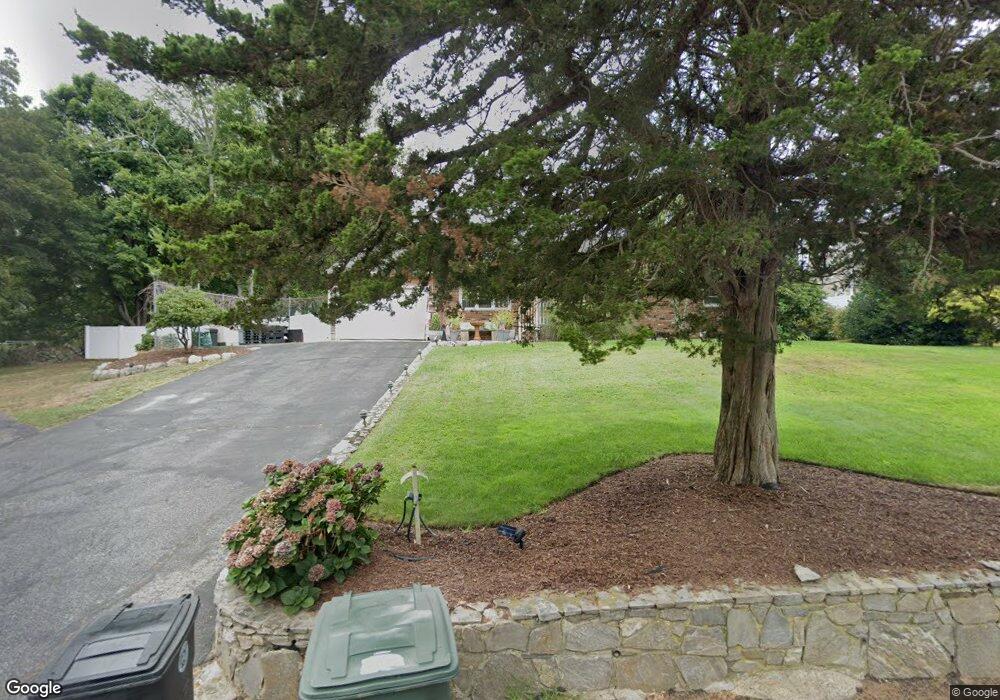
6 Sharp St Coventry, RI 02816
West Warwick Centre NeighborhoodEstimated Value: $436,000 - $557,000
3
Beds
2
Baths
1,664
Sq Ft
$288/Sq Ft
Est. Value
About This Home
This home is located at 6 Sharp St, Coventry, RI 02816 and is currently estimated at $479,957, approximately $288 per square foot. 6 Sharp St is a home located in Kent County with nearby schools including Alan Shawn Feinstein Ms Of Cov, Coventry High School, and Father John V. Doyle School.
Ownership History
Date
Name
Owned For
Owner Type
Purchase Details
Closed on
Jun 28, 1996
Sold by
Sprague Gary W and Sprague Patricia
Bought by
Medeiros Joseph F and Medeiros Johna
Current Estimated Value
Purchase Details
Closed on
Jun 29, 1990
Sold by
Dlugosz Mildred
Bought by
Sprague Gary
Create a Home Valuation Report for This Property
The Home Valuation Report is an in-depth analysis detailing your home's value as well as a comparison with similar homes in the area
Home Values in the Area
Average Home Value in this Area
Purchase History
| Date | Buyer | Sale Price | Title Company |
|---|---|---|---|
| Medeiros Joseph F | $128,000 | -- | |
| Sprague Gary | $125,000 | -- |
Source: Public Records
Mortgage History
| Date | Status | Borrower | Loan Amount |
|---|---|---|---|
| Open | Sprague Gary | $75,000 | |
| Open | Sprague Gary | $125,000 | |
| Closed | Sprague Gary | $13,200 |
Source: Public Records
Tax History
| Year | Tax Paid | Tax Assessment Tax Assessment Total Assessment is a certain percentage of the fair market value that is determined by local assessors to be the total taxable value of land and additions on the property. | Land | Improvement |
|---|---|---|---|---|
| 2025 | $5,530 | $343,700 | $97,500 | $246,200 |
| 2024 | $5,528 | $349,000 | $97,500 | $251,500 |
| 2023 | $5,350 | $349,000 | $97,500 | $251,500 |
| 2022 | $4,763 | $243,400 | $93,300 | $150,100 |
| 2021 | $4,722 | $243,400 | $93,300 | $150,100 |
| 2020 | $5,413 | $243,400 | $93,300 | $150,100 |
| 2019 | $4,768 | $214,400 | $78,400 | $136,000 |
| 2018 | $4,635 | $214,500 | $78,400 | $136,100 |
| 2017 | $4,500 | $214,500 | $78,400 | $136,100 |
| 2016 | $4,059 | $189,600 | $74,100 | $115,500 |
| 2015 | $3,949 | $189,600 | $74,100 | $115,500 |
| 2014 | $3,867 | $189,600 | $74,100 | $115,500 |
| 2013 | $3,851 | $206,400 | $82,800 | $123,600 |
Source: Public Records
Map
Nearby Homes
- 123 Doolittle St
- 77 Macarthur Blvd
- 87 Bates Ave
- 58 Read Ave
- 0 Beaulieu Ave
- 420 Washington St
- 31 Anthony St Unit 33
- 125 Read Ave
- 37 Phillip St
- 2 Ritchotte Ct
- 27 Matteson St
- 22 Wood St
- 37 West St
- 32 Pilgrim Ave
- 11 Wood St
- 91 Windsor Park Dr
- 176 Archambault Ave
- 54 Arthur St
- 175 Gervais St
- 131 Pawtuxet Terrace
Your Personal Tour Guide
Ask me questions while you tour the home.