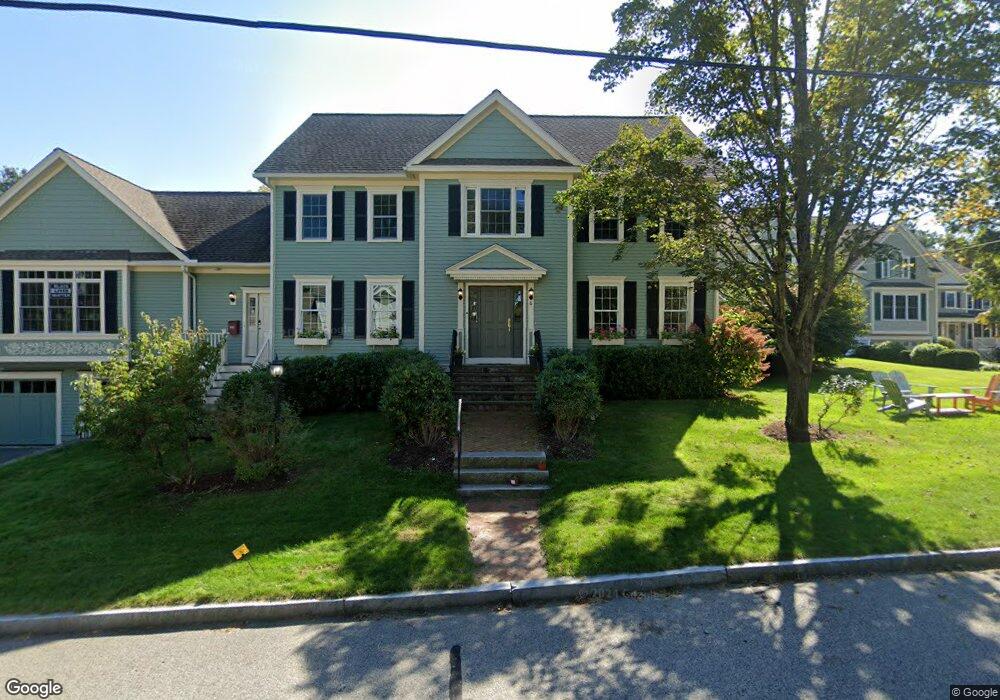
6 Shirley Rd Needham Heights, MA 02494
Estimated Value: $2,232,067 - $2,807,000
5
Beds
5
Baths
4,000
Sq Ft
$629/Sq Ft
Est. Value
About This Home
This home is located at 6 Shirley Rd, Needham Heights, MA 02494 and is currently estimated at $2,514,517, approximately $628 per square foot. 6 Shirley Rd is a home located in Norfolk County with nearby schools including Sunita L. Williams Elementary School, High Rock Middle School, and Pollard Middle School.
Ownership History
Date
Name
Owned For
Owner Type
Purchase Details
Closed on
Dec 21, 2009
Sold by
North Shore Constr & Dev
Bought by
Limaj Idriz and Limaj Michelle B
Current Estimated Value
Home Financials for this Owner
Home Financials are based on the most recent Mortgage that was taken out on this home.
Original Mortgage
$800,000
Outstanding Balance
$524,478
Interest Rate
5%
Mortgage Type
Purchase Money Mortgage
Estimated Equity
$1,990,039
Purchase Details
Closed on
Apr 4, 2008
Sold by
828 Central Avenue Rt and Roman
Bought by
North Shore Constr & Dev
Home Financials for this Owner
Home Financials are based on the most recent Mortgage that was taken out on this home.
Original Mortgage
$4,160,000
Interest Rate
6.06%
Mortgage Type
Purchase Money Mortgage
Create a Home Valuation Report for This Property
The Home Valuation Report is an in-depth analysis detailing your home's value as well as a comparison with similar homes in the area
Home Values in the Area
Average Home Value in this Area
Purchase History
We collect this data history from publicly available records. To have your information removed, we recommend requesting removal directly through your county’s website.
| Date | Buyer | Sale Price | Title Company |
|---|---|---|---|
| Limaj Idriz | $1,040,000 | -- | |
| Limaj Idriz | $1,040,000 | -- | |
| North Shore Constr & Dev | $450,000 | -- | |
| North Shore Constr & Dev | $450,000 | -- |
Source: Public Records
Mortgage History
We collect this data history from publicly available records. To have your information removed, we recommend requesting removal directly through your county’s website.
| Date | Status | Borrower | Loan Amount |
|---|---|---|---|
| Open | Limaj Idriz | $800,000 | |
| Closed | North Shore Constr & Dev | $800,000 | |
| Previous Owner | North Shore Constr & Dev | $4,160,000 |
Source: Public Records
Tax History
| Year | Tax Paid | Tax Assessment Tax Assessment Total Assessment is a certain percentage of the fair market value that is determined by local assessors to be the total taxable value of land and additions on the property. | Land | Improvement |
|---|---|---|---|---|
| 2025 | $21,558 | $2,033,800 | $742,100 | $1,291,700 |
| 2024 | $20,560 | $1,642,200 | $491,500 | $1,150,700 |
| 2023 | $20,099 | $1,541,300 | $491,500 | $1,049,800 |
| 2022 | $19,205 | $1,436,400 | $442,800 | $993,600 |
| 2021 | $18,716 | $1,436,400 | $442,800 | $993,600 |
| 2020 | $17,372 | $1,390,900 | $442,700 | $948,200 |
| 2019 | $16,473 | $1,329,500 | $402,500 | $927,000 |
| 2018 | $15,794 | $1,329,500 | $402,500 | $927,000 |
| 2017 | $14,450 | $1,215,300 | $402,500 | $812,800 |
| 2016 | $12,866 | $1,114,900 | $402,500 | $712,400 |
| 2015 | $12,587 | $1,114,900 | $402,500 | $712,400 |
| 2014 | $12,223 | $1,050,100 | $365,900 | $684,200 |
Source: Public Records
Map
Nearby Homes
- 81 Parish Rd
- 114 Parish Rd
- 27 Rolling Ln
- 100 Rosemary Way Unit 206
- 100 Rosemary Way Unit 231
- 277 Rosemary St
- 20 Crescent Rd Unit 20
- 447 Hillside Ave
- 449 Hillside Ave
- 170 West St Unit 170
- 170 West St
- 56 Crescent Rd
- 56 Crescent Rd Unit 56
- 52 Hancock Rd
- 102 Booth St
- 17 Sunrise Terrace
- 84 Glendale Rd
- 140 Hillside Ave
- 140 Hillside Ave Unit a
- 134 Hillside Ave Unit 134
Your Personal Tour Guide
Ask me questions while you tour the home.