Estimated Value: $228,372 - $284,000
2
Beds
1
Bath
1,040
Sq Ft
$249/Sq Ft
Est. Value
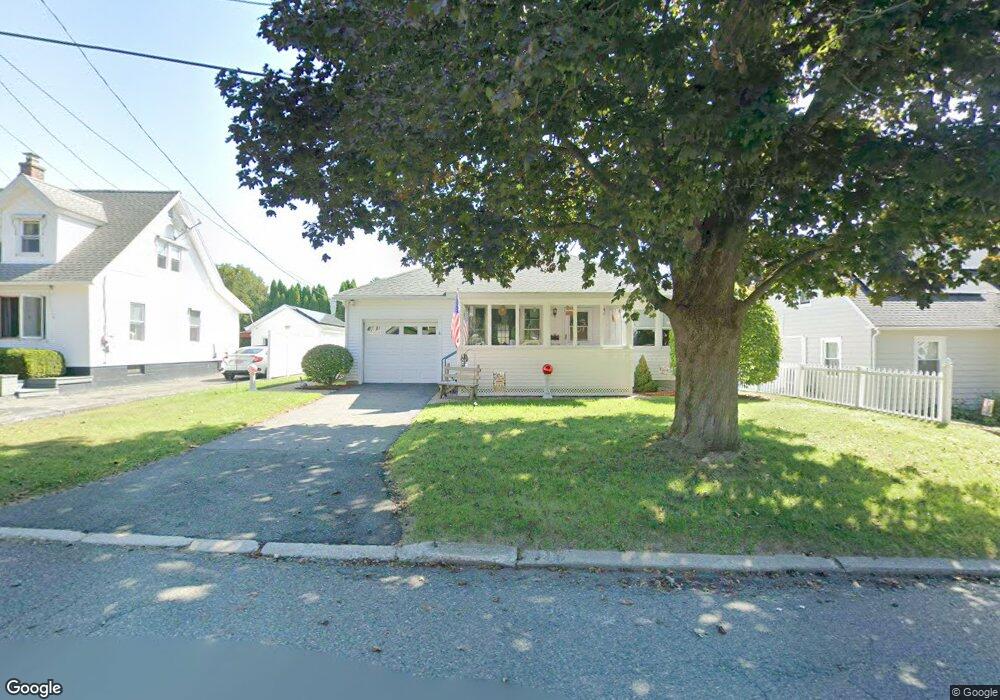
About This Home
This home is located at 6 Simon Ave, Adams, MA 01220 and is currently estimated at $258,593, approximately $248 per square foot. 6 Simon Ave is a home located in Berkshire County with nearby schools including Hoosac Valley Middle & High School, Berkshire Arts & Technology Charter Public School, and St. Stanislaus Kostka School.
Ownership History
Date
Name
Owned For
Owner Type
Purchase Details
Closed on
Jul 12, 2021
Sold by
Hagen Michael G
Bought by
Hagen Nt
Current Estimated Value
Purchase Details
Closed on
Dec 20, 2016
Sold by
Hagen Constance E
Bought by
Hagen Michael J
Purchase Details
Closed on
Sep 15, 2008
Sold by
Mastroianni Anne Marie
Bought by
Hagen Constance E
Home Financials for this Owner
Home Financials are based on the most recent Mortgage that was taken out on this home.
Original Mortgage
$148,000
Interest Rate
6.58%
Mortgage Type
Purchase Money Mortgage
Purchase Details
Closed on
Jul 26, 2005
Sold by
Meaney David and Weiner Sharyn
Bought by
Mastroianni Anne Marie
Home Financials for this Owner
Home Financials are based on the most recent Mortgage that was taken out on this home.
Original Mortgage
$102,400
Interest Rate
5.59%
Mortgage Type
Purchase Money Mortgage
Create a Home Valuation Report for This Property
The Home Valuation Report is an in-depth analysis detailing your home's value as well as a comparison with similar homes in the area
Home Values in the Area
Average Home Value in this Area
Purchase History
| Date | Buyer | Sale Price | Title Company |
|---|---|---|---|
| Hagen Nt | -- | None Available | |
| Hagen Michael J | -- | -- | |
| Hagen Constance E | $149,900 | -- | |
| Mastroianni Anne Marie | $128,000 | -- |
Source: Public Records
Mortgage History
| Date | Status | Borrower | Loan Amount |
|---|---|---|---|
| Previous Owner | Hagen Constance E | $148,000 | |
| Previous Owner | Mastroianni Anne Marie | $102,400 |
Source: Public Records
Tax History
| Year | Tax Paid | Tax Assessment Tax Assessment Total Assessment is a certain percentage of the fair market value that is determined by local assessors to be the total taxable value of land and additions on the property. | Land | Improvement |
|---|---|---|---|---|
| 2025 | $3,077 | $180,900 | $46,200 | $134,700 |
| 2024 | $2,905 | $165,600 | $43,400 | $122,200 |
| 2023 | $2,710 | $146,100 | $39,500 | $106,600 |
| 2022 | $2,638 | $126,300 | $34,300 | $92,000 |
| 2021 | $2,592 | $114,600 | $34,300 | $80,300 |
| 2020 | $2,499 | $114,200 | $34,300 | $79,900 |
| 2019 | $2,443 | $114,200 | $34,300 | $79,900 |
| 2018 | $2,505 | $112,800 | $34,300 | $78,500 |
| 2017 | $2,411 | $112,800 | $34,300 | $78,500 |
| 2016 | $2,297 | $107,400 | $34,300 | $73,100 |
| 2015 | $2,252 | $105,400 | $35,900 | $69,500 |
| 2014 | $2,103 | $105,400 | $35,900 | $69,500 |
Source: Public Records
Map
Nearby Homes
Your Personal Tour Guide
Ask me questions while you tour the home.