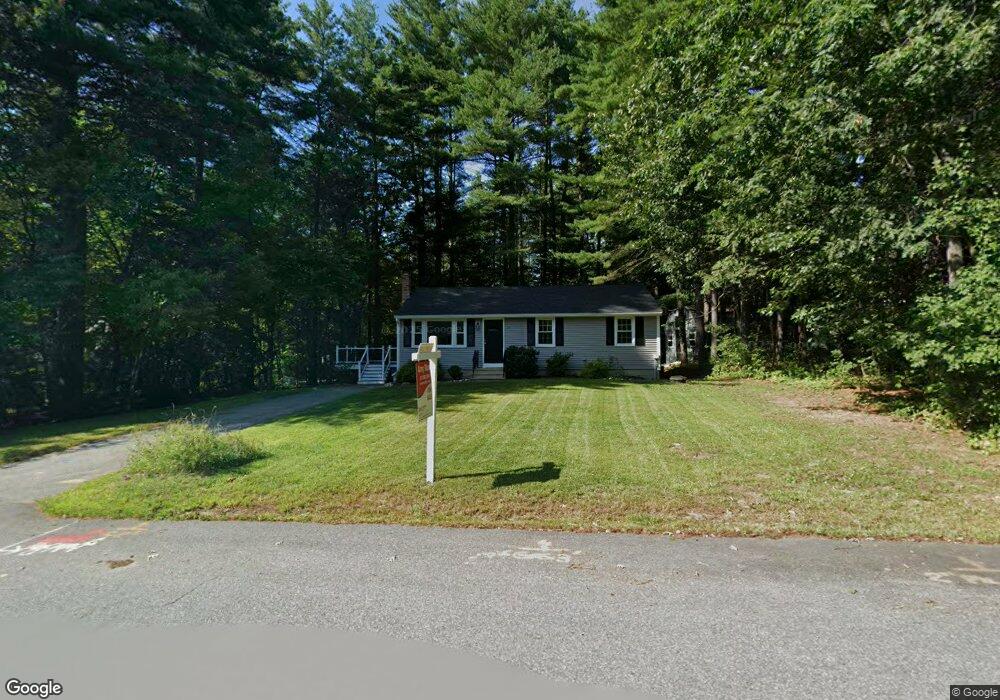
6 Simonne Ln Pepperell, MA 01463
Estimated Value: $543,990 - $652,000
3
Beds
3
Baths
1,536
Sq Ft
$380/Sq Ft
Est. Value
About This Home
This home is located at 6 Simonne Ln, Pepperell, MA 01463 and is currently estimated at $583,248, approximately $379 per square foot. 6 Simonne Ln is a home located in Middlesex County with nearby schools including North Middlesex Regional High School, Pepperell Christian Academy, and Maple Dene & Moppet School.
Ownership History
Date
Name
Owned For
Owner Type
Purchase Details
Closed on
Nov 30, 1993
Sold by
Finan Timothy M and Finan Robyn A
Bought by
Saindon Gary N and Saindon Rosemarie
Current Estimated Value
Home Financials for this Owner
Home Financials are based on the most recent Mortgage that was taken out on this home.
Original Mortgage
$123,300
Interest Rate
6.72%
Mortgage Type
Purchase Money Mortgage
Create a Home Valuation Report for This Property
The Home Valuation Report is an in-depth analysis detailing your home's value as well as a comparison with similar homes in the area
Home Values in the Area
Average Home Value in this Area
Purchase History
| Date | Buyer | Sale Price | Title Company |
|---|---|---|---|
| Saindon Gary N | $137,000 | -- |
Source: Public Records
Mortgage History
| Date | Status | Borrower | Loan Amount |
|---|---|---|---|
| Closed | Saindon Gary N | $123,300 |
Source: Public Records
Tax History
| Year | Tax Paid | Tax Assessment Tax Assessment Total Assessment is a certain percentage of the fair market value that is determined by local assessors to be the total taxable value of land and additions on the property. | Land | Improvement |
|---|---|---|---|---|
| 2025 | $6,952 | $475,200 | $176,300 | $298,900 |
| 2024 | $6,351 | $442,600 | $161,000 | $281,600 |
| 2023 | $5,844 | $386,000 | $145,800 | $240,200 |
| 2022 | $5,738 | $334,600 | $130,000 | $204,600 |
| 2021 | $5,519 | $308,000 | $114,800 | $193,200 |
| 2020 | $5,284 | $311,200 | $114,800 | $196,400 |
| 2019 | $4,785 | $288,400 | $114,800 | $173,600 |
| 2018 | $4,570 | $278,800 | $114,800 | $164,000 |
| 2017 | $4,343 | $273,300 | $114,800 | $158,500 |
| 2016 | $4,281 | $259,000 | $114,800 | $144,200 |
| 2015 | $4,131 | $259,000 | $114,800 | $144,200 |
| 2014 | $3,946 | $248,800 | $107,200 | $141,600 |
Source: Public Records
Map
Nearby Homes
Your Personal Tour Guide
Ask me questions while you tour the home.