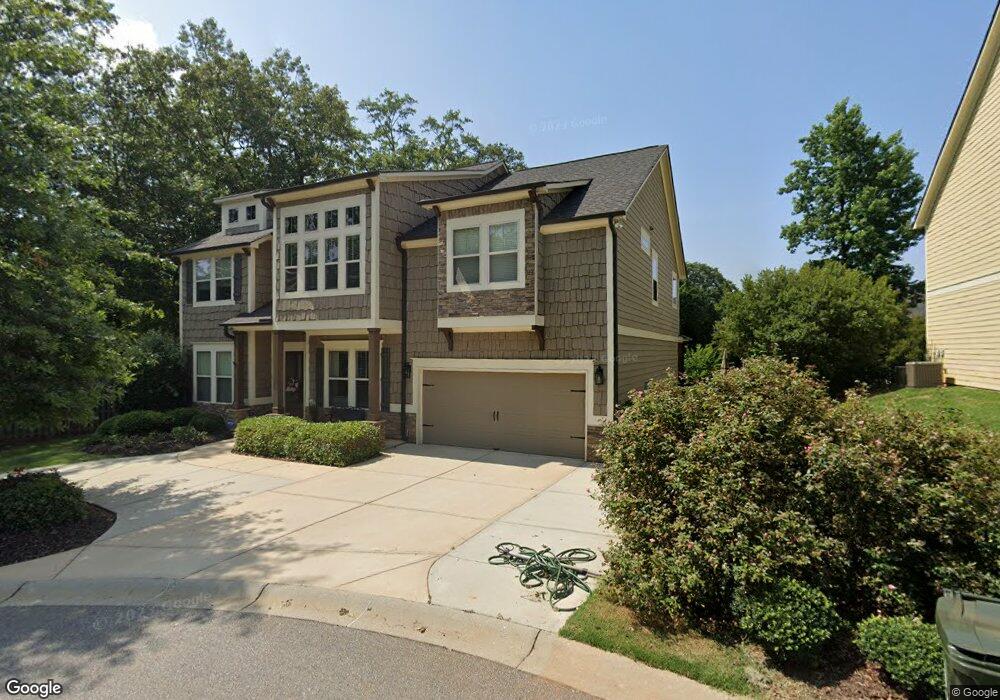
6 Sleepy Orange Cir Unit PM 20 Greenville, SC 29607
Verdae NeighborhoodEstimated Value: $844,575 - $994,000
4
Beds
4
Baths
3,393
Sq Ft
$263/Sq Ft
Est. Value
About This Home
This home is located at 6 Sleepy Orange Cir Unit PM 20, Greenville, SC 29607 and is currently estimated at $892,394, approximately $263 per square foot. 6 Sleepy Orange Cir Unit PM 20 is a home located in Greenville County with nearby schools including Sara Collins Elementary School, Beck Academy, and J. L. Mann High Academy.
Ownership History
Date
Name
Owned For
Owner Type
Purchase Details
Closed on
Nov 13, 2017
Sold by
Cardell Michelle G
Bought by
Cardell Michelle Greer and Michelle Greer Cardell Trust
Current Estimated Value
Purchase Details
Closed on
Aug 14, 2015
Sold by
Cooper Kenneth L and Cooper Latressa A
Bought by
Cardell Michelle G
Home Financials for this Owner
Home Financials are based on the most recent Mortgage that was taken out on this home.
Original Mortgage
$334,600
Outstanding Balance
$263,875
Interest Rate
4.11%
Mortgage Type
New Conventional
Estimated Equity
$628,519
Purchase Details
Closed on
Oct 10, 2014
Sold by
Meritage Homes Of South Carolina Inc
Bought by
Cooper Kenneth L and Cooper Latressa A
Home Financials for this Owner
Home Financials are based on the most recent Mortgage that was taken out on this home.
Original Mortgage
$384,750
Interest Rate
4.15%
Mortgage Type
New Conventional
Create a Home Valuation Report for This Property
The Home Valuation Report is an in-depth analysis detailing your home's value as well as a comparison with similar homes in the area
Home Values in the Area
Average Home Value in this Area
Purchase History
| Date | Buyer | Sale Price | Title Company |
|---|---|---|---|
| Cardell Michelle Greer | -- | None Available | |
| Cardell Michelle G | $418,500 | -- | |
| Cooper Kenneth L | $405,000 | -- |
Source: Public Records
Mortgage History
| Date | Status | Borrower | Loan Amount |
|---|---|---|---|
| Open | Cardell Michelle G | $334,600 | |
| Previous Owner | Cooper Kenneth L | $384,750 |
Source: Public Records
Tax History Compared to Growth
Tax History
| Year | Tax Paid | Tax Assessment Tax Assessment Total Assessment is a certain percentage of the fair market value that is determined by local assessors to be the total taxable value of land and additions on the property. | Land | Improvement |
|---|---|---|---|---|
| 2024 | $3,542 | $17,260 | $3,400 | $13,860 |
| 2023 | $3,542 | $17,260 | $3,400 | $13,860 |
| 2022 | $3,462 | $17,260 | $3,400 | $13,860 |
| 2021 | $3,464 | $17,260 | $3,400 | $13,860 |
| 2020 | $3,447 | $16,360 | $3,200 | $13,160 |
| 2019 | $3,448 | $16,360 | $3,200 | $13,160 |
| 2018 | $3,441 | $16,360 | $3,200 | $13,160 |
| 2017 | $3,439 | $16,360 | $3,200 | $13,160 |
| 2016 | $3,347 | $409,100 | $80,000 | $329,100 |
| 2015 | $3,678 | $450,460 | $80,000 | $370,460 |
| 2014 | $9,208 | $450,460 | $80,000 | $370,460 |
Source: Public Records
Map
Nearby Homes
- 704 Calle Place
- 35 Annacey Place Unit 9C
- 15 Annacey Place
- 310 Henderson Rd
- 20 Hollow Hill Rd
- 15 Orchard Meadow Ln
- 15 Evelyn Ave
- 27 Rollins Ave
- 29 Rollins Ave
- 23 Richwood Dr
- 11 Willow Springs Dr
- 601 Parkins Mill Rd
- 303 Verlin Dr
- 8 Village Crest Dr
- 15 Plymouth Ave
- 208 Parkins Mill Rd
- 329 Algonquin Trail
- 36 Village Crest Dr
- 331 Algonquin Trail
- 48 Village Crest Dr
- 6 Sleepy Orange Cir
- 4 Sleepy Orange Cir
- 8 Meredith Ln
- 6 Meredith Ln
- 10 Meredith Ln
- 3 Cloudless Cir
- 9 Sleepy Orange Cir
- 4 Meredith Ln
- 2 Sleepy Orange Cir
- 7 Sleepy Orange Cir Unit PM 22
- 7 Sleepy Orange Cir
- 105 Swallowtail Place
- 12 Meredith Ln
- 5 Sleepy Orange Cir
- 5 Cloudless Cir
- 3 Sleepy Orange Cir
- 107 Swallowtail Place
- 7 Meredith Ln
- 9 Meredith Ln
- 5 Meredith Ln