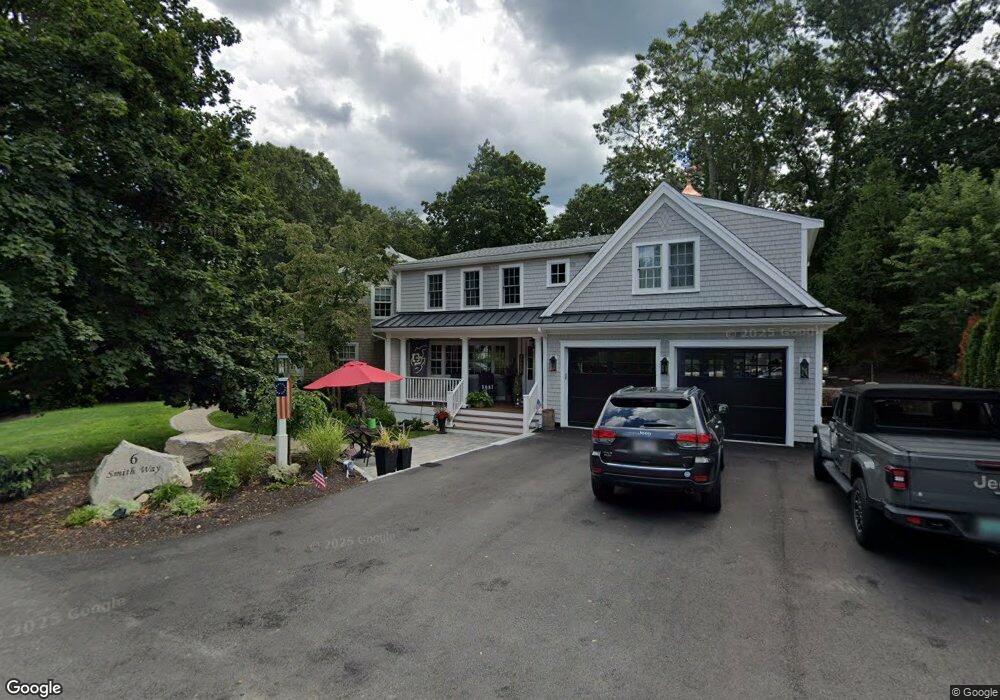
6 Smith Way Hingham, MA 02043
Estimated Value: $1,220,000 - $1,811,971
3
Beds
4
Baths
4,076
Sq Ft
$384/Sq Ft
Est. Value
About This Home
This home is located at 6 Smith Way, Hingham, MA 02043 and is currently estimated at $1,564,993, approximately $383 per square foot. 6 Smith Way is a home located in Plymouth County with nearby schools including Plymouth River Elementary School, Hingham Middle School, and Hingham High School.
Ownership History
Date
Name
Owned For
Owner Type
Purchase Details
Closed on
Feb 10, 2023
Sold by
Engel William J and Engel Mollie B
Bought by
Engel Mollie B
Current Estimated Value
Purchase Details
Closed on
Apr 18, 2022
Sold by
Engel William J and Engel Mollie B
Bought by
Engel Mollie B
Home Financials for this Owner
Home Financials are based on the most recent Mortgage that was taken out on this home.
Original Mortgage
$511,000
Interest Rate
3.85%
Mortgage Type
New Conventional
Purchase Details
Closed on
May 1, 2002
Sold by
James Donald W
Bought by
Engel William J and Engel Mollie Bt
Purchase Details
Closed on
Apr 10, 1998
Sold by
Anderson Ellen M
Bought by
Wilson Russell W and James Donald W
Create a Home Valuation Report for This Property
The Home Valuation Report is an in-depth analysis detailing your home's value as well as a comparison with similar homes in the area
Purchase History
| Date | Buyer | Sale Price | Title Company |
|---|---|---|---|
| Engel Mollie B | -- | None Available | |
| Engel Mollie B | -- | None Available | |
| Engel Mollie B | -- | None Available | |
| Engel Mollie B | -- | None Available | |
| Engel William J | $442,000 | -- | |
| Wilson Russell W | $217,000 | -- | |
| Wilson Russell W | $217,000 | -- |
Source: Public Records
Mortgage History
| Date | Status | Borrower | Loan Amount |
|---|---|---|---|
| Previous Owner | Engel Mollie B | $511,000 | |
| Previous Owner | Wilson Russell W | $417,000 |
Source: Public Records
Tax History
| Year | Tax Paid | Tax Assessment Tax Assessment Total Assessment is a certain percentage of the fair market value that is determined by local assessors to be the total taxable value of land and additions on the property. | Land | Improvement |
|---|---|---|---|---|
| 2025 | $15,756 | $1,473,900 | $434,600 | $1,039,300 |
| 2024 | $11,443 | $1,054,700 | $434,600 | $620,100 |
| 2023 | $9,727 | $972,700 | $434,600 | $538,100 |
| 2022 | $8,993 | $777,900 | $335,500 | $442,400 |
| 2021 | $8,714 | $738,500 | $335,500 | $403,000 |
| 2020 | $8,515 | $738,500 | $335,500 | $403,000 |
| 2019 | $8,314 | $704,000 | $335,500 | $368,500 |
| 2018 | $8,205 | $697,100 | $335,500 | $361,600 |
| 2017 | $8,318 | $679,000 | $329,400 | $349,600 |
| 2016 | $8,247 | $660,300 | $313,800 | $346,500 |
| 2015 | $8,086 | $645,300 | $298,800 | $346,500 |
Source: Public Records
Map
Nearby Homes
Your Personal Tour Guide
Ask me questions while you tour the home.