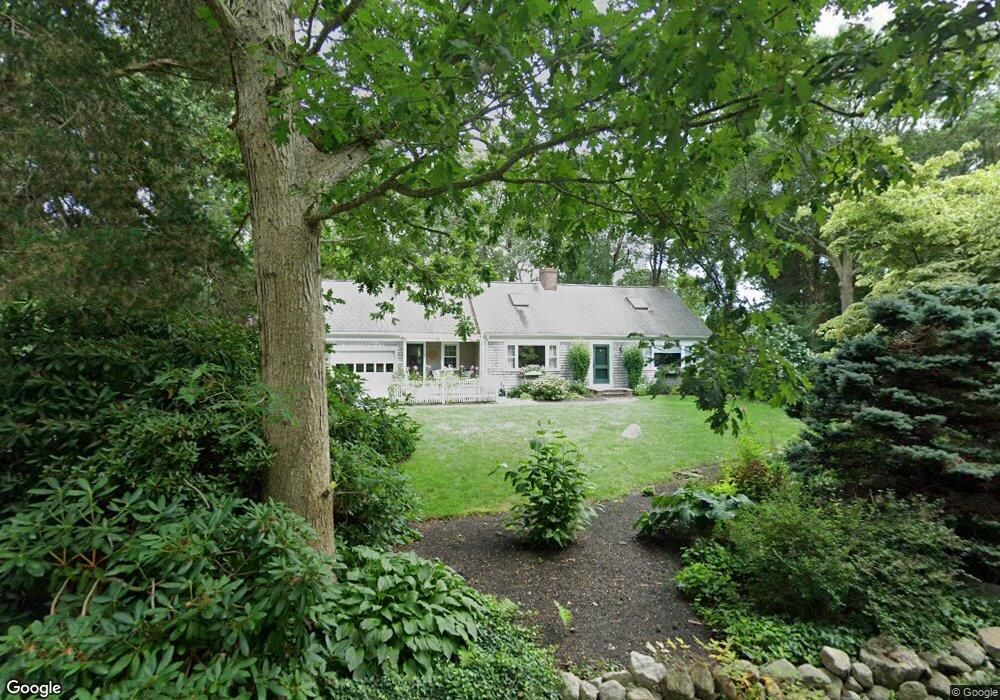
6 Snug Harbor Ln Falmouth, MA 02540
Estimated Value: $1,304,461 - $1,430,000
4
Beds
3
Baths
2,416
Sq Ft
$562/Sq Ft
Est. Value
About This Home
This home is located at 6 Snug Harbor Ln, Falmouth, MA 02540 and is currently estimated at $1,357,615, approximately $561 per square foot. 6 Snug Harbor Ln is a home located in Barnstable County with nearby schools including North Falmouth Elementary School, Morse Pond School, and Lawrence School.
Ownership History
Date
Name
Owned For
Owner Type
Purchase Details
Closed on
Jul 8, 2013
Sold by
Oconnell Paul
Bought by
Paul Oconnell Ret and Oconnell
Current Estimated Value
Purchase Details
Closed on
Mar 11, 2013
Sold by
Paul Oconnell Ret and Oconnell
Bought by
Oconnell Paul
Home Financials for this Owner
Home Financials are based on the most recent Mortgage that was taken out on this home.
Original Mortgage
$381,000
Interest Rate
3.45%
Mortgage Type
New Conventional
Purchase Details
Closed on
Dec 13, 2011
Sold by
Oconnell Paul
Bought by
Paul Oconnell Revoc Lt and Oconnell
Purchase Details
Closed on
Nov 22, 2011
Sold by
6 Snug Harbor Lane Ret and Oconnell
Bought by
Oconnell Paul
Purchase Details
Closed on
May 23, 1996
Sold by
Romaine Jacqueline Est and Romaine
Bought by
Oconnell Paul F and Oconnell Sandra
Create a Home Valuation Report for This Property
The Home Valuation Report is an in-depth analysis detailing your home's value as well as a comparison with similar homes in the area
Home Values in the Area
Average Home Value in this Area
Purchase History
| Date | Buyer | Sale Price | Title Company |
|---|---|---|---|
| Paul Oconnell Ret | -- | -- | |
| Paul Oconnell Ret | -- | -- | |
| Oconnell Paul | -- | -- | |
| Oconnell Paul | -- | -- | |
| Paul Oconnell Revoc Lt | -- | -- | |
| Paul Oconnell Revoc Lt | -- | -- | |
| Oconnell Paul | -- | -- | |
| Oconnell Paul | -- | -- | |
| Oconnell Paul F | $257,000 | -- | |
| Oconnell Paul F | $257,000 | -- |
Source: Public Records
Mortgage History
| Date | Status | Borrower | Loan Amount |
|---|---|---|---|
| Previous Owner | Oconnell Paul | $381,000 | |
| Previous Owner | Oconnell Paul F | $250,000 | |
| Previous Owner | Oconnell Paul F | $100,000 |
Source: Public Records
Tax History Compared to Growth
Tax History
| Year | Tax Paid | Tax Assessment Tax Assessment Total Assessment is a certain percentage of the fair market value that is determined by local assessors to be the total taxable value of land and additions on the property. | Land | Improvement |
|---|---|---|---|---|
| 2025 | $6,756 | $1,151,000 | $624,500 | $526,500 |
| 2024 | $6,747 | $1,074,300 | $596,900 | $477,400 |
| 2023 | $5,922 | $855,800 | $446,300 | $409,500 |
| 2022 | $6,248 | $776,100 | $445,700 | $330,400 |
| 2021 | $5,867 | $690,200 | $426,300 | $263,900 |
| 2020 | $5,596 | $651,400 | $387,500 | $263,900 |
| 2019 | $5,517 | $644,500 | $387,500 | $257,000 |
| 2018 | $5,447 | $633,400 | $387,500 | $245,900 |
| 2017 | $5,334 | $625,300 | $387,500 | $237,800 |
| 2016 | $5,234 | $625,300 | $387,500 | $237,800 |
| 2015 | $5,121 | $625,300 | $387,500 | $237,800 |
| 2014 | $5,050 | $619,600 | $387,600 | $232,000 |
Source: Public Records
Map
Nearby Homes
- 102 Nashawena St
- 22 Acorn Dr
- 4 Ambleside Dr
- 106 Ambleside Dr
- 126 Ambleside Dr
- 850 W Falmouth Hwy Unit 11
- 0 Chapoquoit Rd
- 113 Blacksmith Shop Rd
- 24 Jae Rd
- 908 W Falmouth Hwy
- 82 Dale Dr
- 37 Katelyn Hills Dr
- 345 Quaker Rd
- 0 Quaker Rd Unit 73423088
- 0 Quaker Rd Unit 22504204
- 104 Streeter Hill Rd
- 61 Mckenna Ridge Dr
- 104 Streeter Hill Rd
- 275 W Falmouth Hwy
- 9 Lummis Ln
- 10 Snug Harbor Ln
- 3 Lummis Ln
- 19 Lummis Ln
- 141 Nashawena St
- 11 Snug Harbor Ln
- 139 Nashawena St
- 7 Shapquit Bars Rd
- 21 Snug Harbor Ln
- 137 Nashawena St
- 137 Nashawena St Unit n/a
- 16 Lummis Ln
- 10 Lummis Ln
- 3 Quaker Rd
- 11 Little Island Rd
- 12 Little Island Rd
- 26 Lummis Ln
- 19 Shapquit Bars Rd
- 18 Little Island Rd
- 4 Shapquit Bars Rd