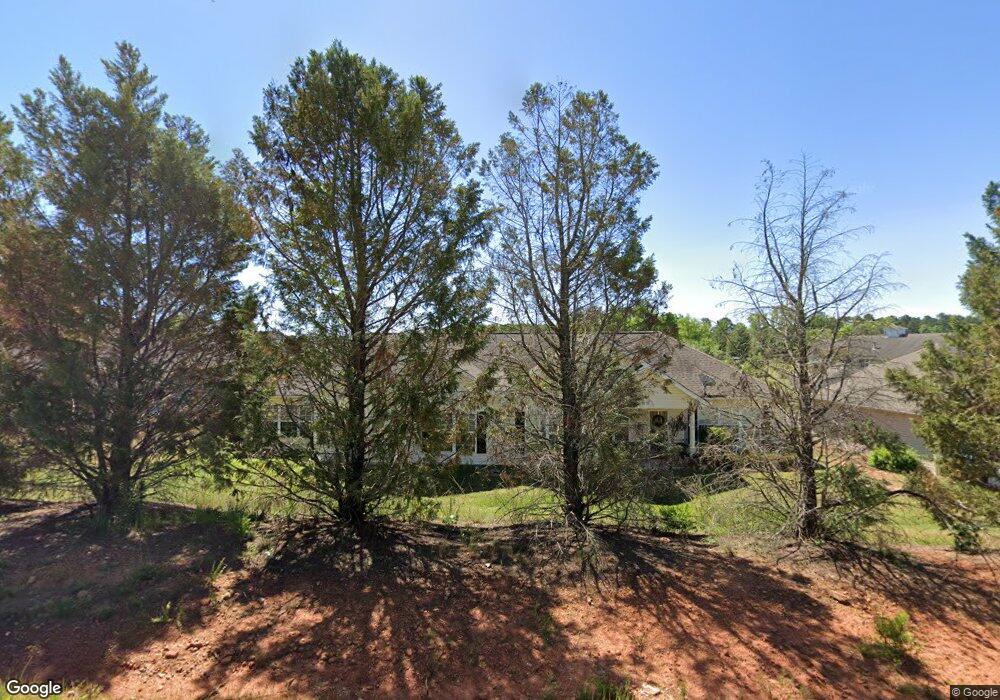
6 Southwoode Cir Unit 6 Chapin, SC 29036
Estimated Value: $241,000 - $253,000
2
Beds
2
Baths
1,279
Sq Ft
$194/Sq Ft
Est. Value
About This Home
This home is located at 6 Southwoode Cir Unit 6, Chapin, SC 29036 and is currently estimated at $247,955, approximately $193 per square foot. 6 Southwoode Cir Unit 6 is a home located in Lexington County with nearby schools including Chapin Elementary School, Chapin Intermediate, and Chapin High School.
Ownership History
Date
Name
Owned For
Owner Type
Purchase Details
Closed on
Apr 30, 2024
Sold by
Helen K Anderson Revocable Trust and Ward Sharon A
Bought by
Rowley John H and Rowley Diane
Current Estimated Value
Purchase Details
Closed on
Dec 17, 2021
Sold by
Anderson Helen K
Bought by
Anderson Helen K and The Helen K Anderson Revocable
Purchase Details
Closed on
Jun 28, 2013
Sold by
Houseman Verna B
Bought by
Anderson Helen K
Purchase Details
Closed on
Apr 7, 2011
Sold by
Generations Of Chapin Inc
Bought by
Houseman Verna B
Purchase Details
Closed on
Feb 22, 2011
Sold by
Luce Robert Bradley and Luce Shannon Kay
Bought by
Generation Of Chapin Inc
Purchase Details
Closed on
Nov 2, 2009
Sold by
Estate Of Carol Ruth Fuller Luce and Luce Robert L
Bought by
Luce Robert Bradley and Luce Shannon Kay
Create a Home Valuation Report for This Property
The Home Valuation Report is an in-depth analysis detailing your home's value as well as a comparison with similar homes in the area
Home Values in the Area
Average Home Value in this Area
Purchase History
| Date | Buyer | Sale Price | Title Company |
|---|---|---|---|
| Rowley John H | $247,500 | None Listed On Document | |
| Anderson Helen K | -- | None Available | |
| Anderson Helen K | $113,000 | -- | |
| Houseman Verna B | $115,000 | -- | |
| Generation Of Chapin Inc | $100,000 | -- | |
| Luce Robert Bradley | -- | -- |
Source: Public Records
Tax History Compared to Growth
Tax History
| Year | Tax Paid | Tax Assessment Tax Assessment Total Assessment is a certain percentage of the fair market value that is determined by local assessors to be the total taxable value of land and additions on the property. | Land | Improvement |
|---|---|---|---|---|
| 2024 | $1,181 | $7,543 | $0 | $7,543 |
| 2023 | $3,392 | $5,028 | $0 | $5,028 |
| 2022 | $435 | $5,028 | $0 | $5,028 |
| 2020 | $459 | $5,028 | $0 | $5,028 |
| 2019 | $350 | $4,372 | $0 | $4,372 |
| 2018 | $305 | $4,372 | $0 | $4,372 |
| 2017 | $290 | $4,372 | $0 | $4,372 |
| 2016 | $305 | $4,372 | $0 | $4,372 |
| 2014 | $703 | $4,519 | $0 | $4,519 |
| 2013 | -- | $4,920 | $0 | $4,920 |
Source: Public Records
Map
Nearby Homes
- 0 E Boundary St
- 317 Eagle Claw Dr
- 405 Eagle Claw Ct
- 208 Woolbright Ln
- 0 Murray Lindler Rd
- 715 Soldier Gray Ln
- 0 Woodthrush Rd
- 0 Harvest View Rd
- 129 Merowey Ct
- 213 Firebridge Ct
- 100 Recluse St
- 0 Amicks Ferry Rd
- 126 Fair Haven Way
- 538 Griffon Dr
- 542 Griffon Dr
- 530 Griffon Dr
- Porter II Plan at Boykin Hills
- Hidden Creek II Plan at Boykin Hills
- Darcy II Plan at Boykin Hills
- Habersham II Plan at Boykin Hills
- 6 Southwoode Cir
- 4 Southwoode Cir
- 4 Southwoode Cir
- 7B Southwoode Cir
- 7A Southwoode Cir
- 12 Southwoode Cir Unit 12
- 9B Southwoode Cir
- 5B Southwoode Cir
- 9A Southwoode Cir
- 5A Southwoode Cir
- 48 Southwoode Cir
- 2 Southwoode Cir
- 2 Southwoode Cir
- 2 Southwoode Cir
- 14 Southwoode Cir Unit 14
- 11 Southwoode Cir
- 46 Southwoode Cir
- 13A Southwoode Cir
- 44 Southwoode Cir Unit 44
- 13B Southwoode Cir Unit 13B