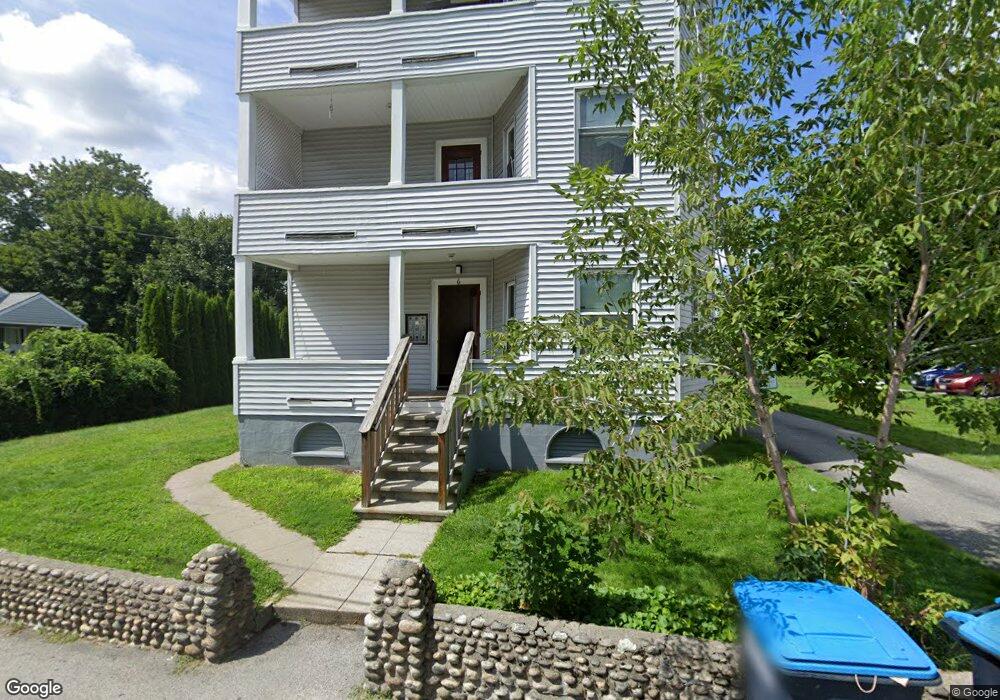
6 Spring St Webster, MA 01570
Estimated Value: $451,675 - $566,000
9
Beds
3
Baths
3,660
Sq Ft
$142/Sq Ft
Est. Value
About This Home
This home is located at 6 Spring St, Webster, MA 01570 and is currently estimated at $518,669, approximately $141 per square foot. 6 Spring St is a home located in Worcester County with nearby schools including Park Avenue Elementary School, Webster Middle School, and Bartlett High School.
Ownership History
Date
Name
Owned For
Owner Type
Purchase Details
Closed on
Oct 8, 2025
Sold by
Kbg Realty Properties Llc
Bought by
Campaniello Michael
Current Estimated Value
Home Financials for this Owner
Home Financials are based on the most recent Mortgage that was taken out on this home.
Original Mortgage
$501,125
Outstanding Balance
$499,774
Interest Rate
6.56%
Mortgage Type
New Conventional
Estimated Equity
$18,895
Purchase Details
Closed on
Jan 12, 2021
Sold by
Perrin Louis J and Perrin Maria V
Bought by
Kbg Realty Properties Llc
Home Financials for this Owner
Home Financials are based on the most recent Mortgage that was taken out on this home.
Original Mortgage
$220,909
Interest Rate
2.67%
Mortgage Type
Purchase Money Mortgage
Purchase Details
Closed on
Apr 30, 2010
Sold by
Ball Mary Jo and Ball Cecilia J
Bought by
Perrin Louis J and Perrin Maria V
Home Financials for this Owner
Home Financials are based on the most recent Mortgage that was taken out on this home.
Original Mortgage
$125,625
Interest Rate
4.99%
Mortgage Type
Purchase Money Mortgage
Create a Home Valuation Report for This Property
The Home Valuation Report is an in-depth analysis detailing your home's value as well as a comparison with similar homes in the area
Home Values in the Area
Average Home Value in this Area
Purchase History
| Date | Buyer | Sale Price | Title Company |
|---|---|---|---|
| Campaniello Michael | $527,500 | -- | |
| Kbg Realty Properties Llc | $330,000 | None Available | |
| Perrin Louis J | $147,500 | -- | |
| Perrin Louis J | $147,500 | -- |
Source: Public Records
Mortgage History
| Date | Status | Borrower | Loan Amount |
|---|---|---|---|
| Open | Campaniello Michael | $501,125 | |
| Previous Owner | Kbg Realty Properties Llc | $220,909 | |
| Previous Owner | Perrin Louis J | $125,625 |
Source: Public Records
Tax History
| Year | Tax Paid | Tax Assessment Tax Assessment Total Assessment is a certain percentage of the fair market value that is determined by local assessors to be the total taxable value of land and additions on the property. | Land | Improvement |
|---|---|---|---|---|
| 2025 | $4,685 | $394,400 | $59,400 | $335,000 |
| 2024 | $4,626 | $379,800 | $57,200 | $322,600 |
| 2023 | $4,059 | $324,700 | $49,500 | $275,200 |
| 2022 | $3,850 | $275,800 | $48,000 | $227,800 |
| 2021 | $2,904 | $192,300 | $48,000 | $144,300 |
| 2020 | $2,801 | $186,000 | $48,000 | $138,000 |
| 2019 | $2,413 | $157,400 | $48,000 | $109,400 |
| 2018 | $2,258 | $146,700 | $48,000 | $98,700 |
| 2017 | $2,139 | $141,400 | $47,000 | $94,400 |
| 2016 | $2,141 | $141,400 | $47,000 | $94,400 |
| 2015 | $2,036 | $138,700 | $46,100 | $92,600 |
Source: Public Records
Map
Nearby Homes
Your Personal Tour Guide
Ask me questions while you tour the home.