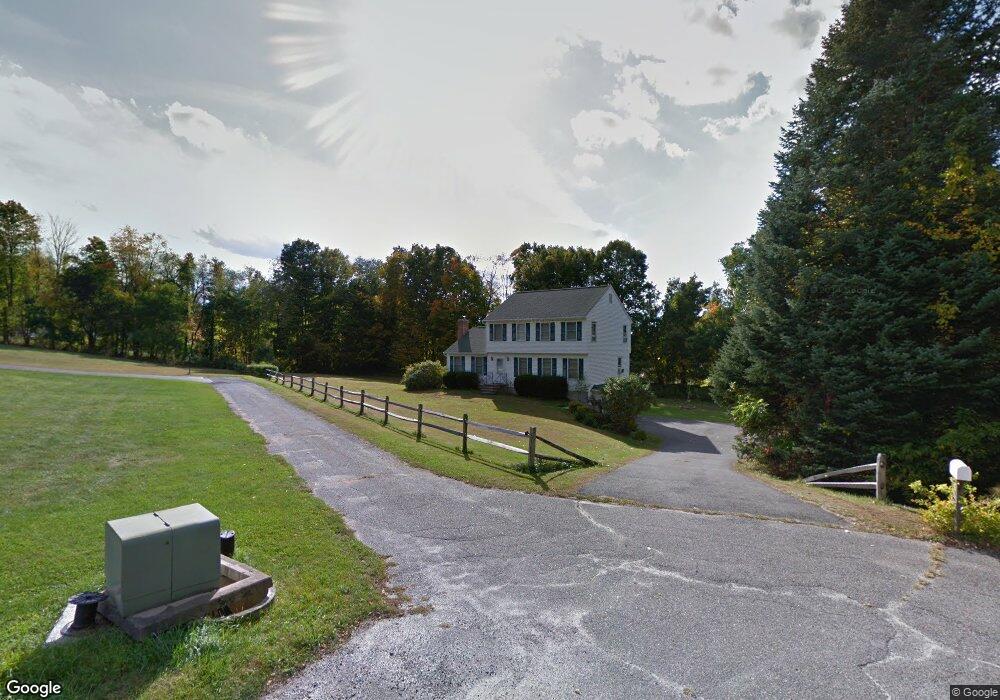
6 Steven Ct New Milford, CT 06776
Estimated Value: $547,000 - $559,000
3
Beds
3
Baths
2,027
Sq Ft
$273/Sq Ft
Est. Value
About This Home
This home is located at 6 Steven Ct, New Milford, CT 06776 and is currently estimated at $552,620, approximately $272 per square foot. 6 Steven Ct is a home located in Litchfield County with nearby schools including Northville Elementary School, Sarah Noble Intermediate School, and Schaghticoke Middle School.
Ownership History
Date
Name
Owned For
Owner Type
Purchase Details
Closed on
Nov 20, 2006
Sold by
Orzech Thomas S and Orzech Joan B
Bought by
Gahinelli Robert A and Gabinelli Catherine Anne
Current Estimated Value
Home Financials for this Owner
Home Financials are based on the most recent Mortgage that was taken out on this home.
Original Mortgage
$215,000
Interest Rate
6.33%
Purchase Details
Closed on
Mar 31, 1999
Sold by
Dobrydnio Rena
Bought by
Orzech Thomas and Orzech Joan
Home Financials for this Owner
Home Financials are based on the most recent Mortgage that was taken out on this home.
Original Mortgage
$127,000
Interest Rate
6.78%
Purchase Details
Closed on
Dec 16, 1991
Sold by
Wrathall David and Wrathall Patricia
Bought by
Baeza Rena
Purchase Details
Closed on
Dec 6, 1989
Sold by
Framing F C Michaud
Bought by
Wrathar David
Create a Home Valuation Report for This Property
The Home Valuation Report is an in-depth analysis detailing your home's value as well as a comparison with similar homes in the area
Home Values in the Area
Average Home Value in this Area
Purchase History
| Date | Buyer | Sale Price | Title Company |
|---|---|---|---|
| Gahinelli Robert A | $370,000 | -- | |
| Orzech Thomas | $222,000 | -- | |
| Baeza Rena | $200,000 | -- | |
| Wrathar David | $214,000 | -- |
Source: Public Records
Mortgage History
| Date | Status | Borrower | Loan Amount |
|---|---|---|---|
| Open | Wrathar David | $220,000 | |
| Closed | Wrathar David | $215,000 | |
| Previous Owner | Wrathar David | $120,500 | |
| Previous Owner | Wrathar David | $127,000 |
Source: Public Records
Tax History Compared to Growth
Tax History
| Year | Tax Paid | Tax Assessment Tax Assessment Total Assessment is a certain percentage of the fair market value that is determined by local assessors to be the total taxable value of land and additions on the property. | Land | Improvement |
|---|---|---|---|---|
| 2025 | $9,704 | $208,400 | $58,950 | $149,450 |
| 2024 | $6,204 | $208,400 | $58,950 | $149,450 |
| 2023 | $6,039 | $208,400 | $58,950 | $149,450 |
| 2022 | $5,908 | $208,400 | $58,950 | $149,450 |
| 2021 | $5,829 | $208,400 | $58,950 | $149,450 |
| 2020 | $6,045 | $210,770 | $65,380 | $145,390 |
| 2019 | $6,049 | $210,770 | $65,380 | $145,390 |
| 2018 | $5,937 | $210,770 | $65,380 | $145,390 |
| 2017 | $5,743 | $210,770 | $65,380 | $145,390 |
| 2016 | $5,642 | $210,770 | $65,380 | $145,390 |
| 2015 | $5,734 | $214,340 | $65,380 | $148,960 |
| 2014 | $5,637 | $214,340 | $65,380 | $148,960 |
Source: Public Records
Map
Nearby Homes
- 5 Delivery Ln
- 31 Sterling Dr
- 75 Buckingham Rd
- 4 High Trail
- 21 Crossmon Rd
- 22 Mountain View Terrace
- 121 Guernsey Ln
- 326 Litchfield Rd
- 151 Guernsey Ln
- 15 Harmony Trail
- 1 Blossom Ct Unit 1
- 85 Weathervane Dr
- 12 Round Table Rd
- 10 Harmony Trail
- 3 Belair Dr Unit 3
- 18 Green Pond Rd
- 58 Chestnut Land Rd
- 40 Mount Tom Rd
- 116 Great Brook Rd
- 0 Chestnut Land Rd Unit 24024843