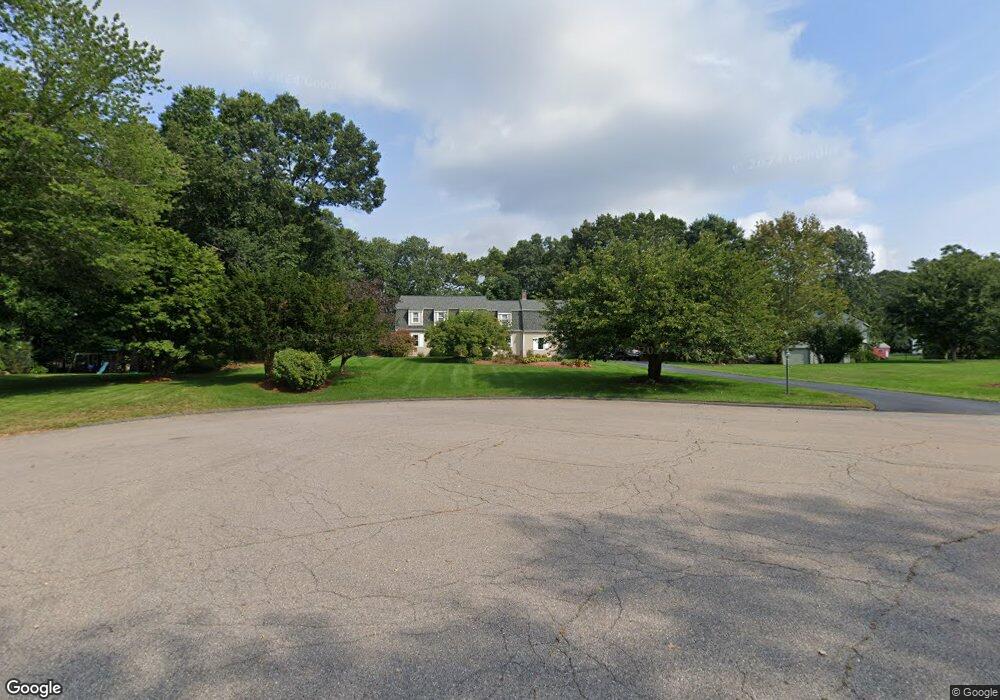
6 Stone End Rd Medway, MA 02053
Estimated Value: $745,577 - $884,000
4
Beds
3
Baths
2,822
Sq Ft
$283/Sq Ft
Est. Value
About This Home
This home is located at 6 Stone End Rd, Medway, MA 02053 and is currently estimated at $798,894, approximately $283 per square foot. 6 Stone End Rd is a home located in Norfolk County with nearby schools including John D. McGovern Elementary School, Burke-Memorial Elementary, and Medway Middle School.
Ownership History
Date
Name
Owned For
Owner Type
Purchase Details
Closed on
Apr 3, 2014
Sold by
Whitney David B and Whitney Janice H
Bought by
Whitney Ft and Whitney David B
Current Estimated Value
Purchase Details
Closed on
May 12, 1986
Bought by
Whitney Ft
Create a Home Valuation Report for This Property
The Home Valuation Report is an in-depth analysis detailing your home's value as well as a comparison with similar homes in the area
Home Values in the Area
Average Home Value in this Area
Purchase History
| Date | Buyer | Sale Price | Title Company |
|---|---|---|---|
| Whitney Ft | -- | -- | |
| Whitney Ft | $240,000 | -- |
Source: Public Records
Mortgage History
| Date | Status | Borrower | Loan Amount |
|---|---|---|---|
| Previous Owner | Whitney Ft | $94,000 | |
| Previous Owner | Whitney Ft | $94,500 | |
| Previous Owner | Whitney Ft | $230,000 |
Source: Public Records
Tax History Compared to Growth
Tax History
| Year | Tax Paid | Tax Assessment Tax Assessment Total Assessment is a certain percentage of the fair market value that is determined by local assessors to be the total taxable value of land and additions on the property. | Land | Improvement |
|---|---|---|---|---|
| 2025 | $9,412 | $660,500 | $340,100 | $320,400 |
| 2024 | $9,511 | $660,500 | $340,100 | $320,400 |
| 2023 | $9,706 | $608,900 | $309,600 | $299,300 |
| 2022 | $8,903 | $525,900 | $229,000 | $296,900 |
| 2021 | $8,611 | $493,200 | $213,700 | $279,500 |
| 2020 | $8,547 | $488,400 | $213,700 | $274,700 |
| 2019 | $8,141 | $479,700 | $205,000 | $274,700 |
| 2018 | $8,572 | $485,400 | $196,300 | $289,100 |
| 2017 | $8,349 | $465,900 | $192,000 | $273,900 |
| 2016 | $8,160 | $450,600 | $176,700 | $273,900 |
| 2015 | $7,980 | $437,500 | $174,500 | $263,000 |
| 2014 | $7,860 | $417,200 | $174,700 | $242,500 |
Source: Public Records
Map
Nearby Homes
- 85 Fisher St
- 78 Fisher St
- 4 Deerfield Rd
- 6 Rainbow Dr
- 190-194 E Main St
- 22 Granite St
- 9 Tulip Way
- 56 Paul Rd
- 39 West St
- 4 E Charles St
- 6 Freedom Trail
- 15 Free St
- 35 Woodland Ave Unit 35A
- Lot 1 Florence St
- 11 Black Bear Unit 11
- 9 Black Bear Cir Unit 9
- 7 Black Bear Unit 7
- 43 Black Bear Cir Unit 43
- 0 Old Log Lane (Farm St) Unit 73416329
- 10 Black Bear Unit 10