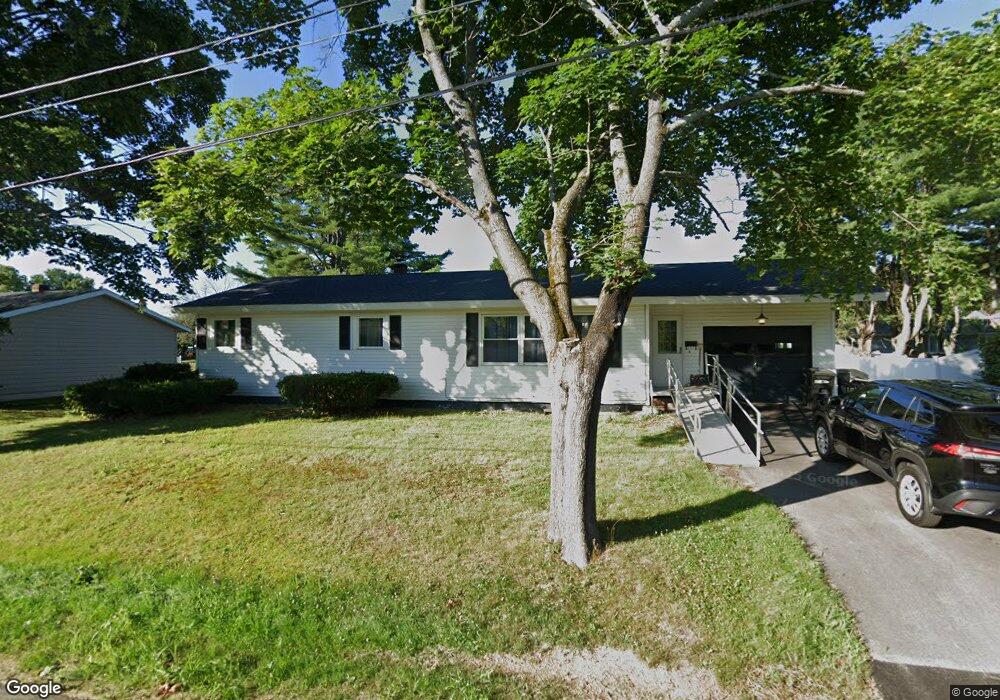
6 Surry Ln Lewiston, ME 04240
Estimated Value: $294,000 - $340,000
3
Beds
2
Baths
1,308
Sq Ft
$244/Sq Ft
Est. Value
About This Home
This home is located at 6 Surry Ln, Lewiston, ME 04240 and is currently estimated at $319,053, approximately $243 per square foot. 6 Surry Ln is a home with nearby schools including Raymond A. Geiger Elementary School, Lewiston Middle School, and Lewiston High School.
Ownership History
Date
Name
Owned For
Owner Type
Purchase Details
Closed on
Jun 27, 2022
Sold by
Girouard-Jordan Terry
Bought by
364 Broadway Llc
Current Estimated Value
Home Financials for this Owner
Home Financials are based on the most recent Mortgage that was taken out on this home.
Original Mortgage
$125,000
Outstanding Balance
$118,747
Interest Rate
5.25%
Mortgage Type
Purchase Money Mortgage
Estimated Equity
$200,306
Purchase Details
Closed on
Oct 1, 2019
Sold by
Girouard Beverly A Est and Girouard-Jordan
Bought by
Girouard-Jordan Terry A and Girouard James R
Create a Home Valuation Report for This Property
The Home Valuation Report is an in-depth analysis detailing your home's value as well as a comparison with similar homes in the area
Home Values in the Area
Average Home Value in this Area
Purchase History
| Date | Buyer | Sale Price | Title Company |
|---|---|---|---|
| 364 Broadway Llc | $185,000 | None Available | |
| Girouard-Jordan Terry A | -- | -- |
Source: Public Records
Mortgage History
| Date | Status | Borrower | Loan Amount |
|---|---|---|---|
| Open | 364 Broadway Llc | $125,000 |
Source: Public Records
Tax History
| Year | Tax Paid | Tax Assessment Tax Assessment Total Assessment is a certain percentage of the fair market value that is determined by local assessors to be the total taxable value of land and additions on the property. | Land | Improvement |
|---|---|---|---|---|
| 2025 | $3,847 | $117,360 | $30,120 | $87,240 |
| 2024 | $3,729 | $117,360 | $30,120 | $87,240 |
| 2023 | $3,521 | $117,360 | $30,120 | $87,240 |
| 2022 | $3,345 | $117,360 | $30,120 | $87,240 |
| 2021 | $3,317 | $117,360 | $30,120 | $87,240 |
| 2020 | $3,365 | $117,360 | $30,120 | $87,240 |
| 2019 | $3,393 | $117,360 | $30,120 | $87,240 |
| 2018 | $3,365 | $117,360 | $30,120 | $87,240 |
| 2017 | $3,288 | $117,360 | $30,120 | $87,240 |
| 2016 | $3,232 | $117,360 | $30,120 | $87,240 |
| 2015 | $3,212 | $117,360 | $30,120 | $87,240 |
| 2014 | $3,121 | $117,360 | $30,120 | $87,240 |
| 2013 | $3,103 | $117,360 | $30,120 | $87,240 |
Source: Public Records
Map
Nearby Homes
Your Personal Tour Guide
Ask me questions while you tour the home.