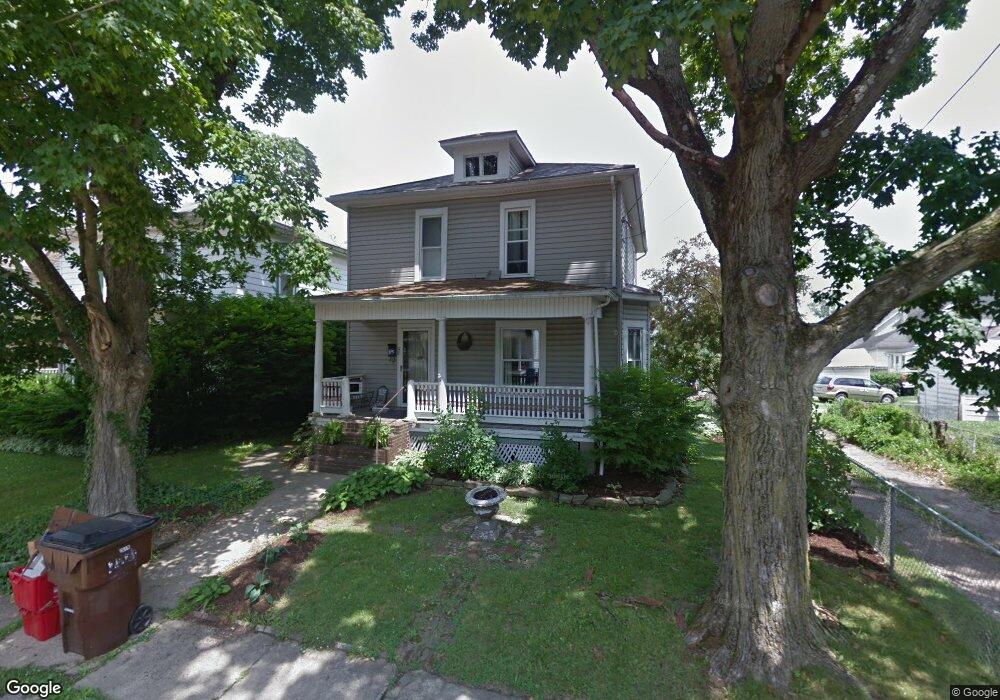
6 Third Ave Mount Vernon, OH 43050
Estimated Value: $186,000 - $218,000
3
Beds
1
Bath
1,400
Sq Ft
$146/Sq Ft
Est. Value
About This Home
This home is located at 6 Third Ave, Mount Vernon, OH 43050 and is currently estimated at $204,581, approximately $146 per square foot. 6 Third Ave is a home located in Knox County with nearby schools including Mount Vernon High School, St. Vincent de Paul School, and Christian Star Academy.
Ownership History
Date
Name
Owned For
Owner Type
Purchase Details
Closed on
Jul 16, 2008
Sold by
Luebke Lee W and Luebke Karen L
Bought by
Miller Kurt R and Miller Heather L
Current Estimated Value
Home Financials for this Owner
Home Financials are based on the most recent Mortgage that was taken out on this home.
Original Mortgage
$84,572
Outstanding Balance
$54,781
Interest Rate
6.15%
Mortgage Type
FHA
Estimated Equity
$149,800
Purchase Details
Closed on
May 30, 1995
Sold by
Platt William D and Platt Dorothy
Bought by
Luebke Lee W and Yarman Kar
Purchase Details
Closed on
Mar 18, 1988
Bought by
Platt William D and Platt Dorothy
Create a Home Valuation Report for This Property
The Home Valuation Report is an in-depth analysis detailing your home's value as well as a comparison with similar homes in the area
Home Values in the Area
Average Home Value in this Area
Purchase History
| Date | Buyer | Sale Price | Title Company |
|---|---|---|---|
| Miller Kurt R | $64,425 | None Available | |
| Luebke Lee W | $65,000 | -- | |
| Platt William D | $76,800 | -- |
Source: Public Records
Mortgage History
| Date | Status | Borrower | Loan Amount |
|---|---|---|---|
| Open | Miller Kurt R | $84,572 |
Source: Public Records
Tax History
| Year | Tax Paid | Tax Assessment Tax Assessment Total Assessment is a certain percentage of the fair market value that is determined by local assessors to be the total taxable value of land and additions on the property. | Land | Improvement |
|---|---|---|---|---|
| 2024 | $1,488 | $39,380 | $6,740 | $32,640 |
| 2023 | $1,521 | $39,380 | $6,740 | $32,640 |
| 2022 | $1,308 | $30,770 | $5,270 | $25,500 |
| 2021 | $1,308 | $30,770 | $5,270 | $25,500 |
| 2020 | $1,274 | $30,770 | $5,270 | $25,500 |
| 2019 | $1,309 | $29,490 | $6,660 | $22,830 |
| 2018 | $1,310 | $29,490 | $6,660 | $22,830 |
| 2017 | $1,286 | $29,490 | $6,660 | $22,830 |
| 2016 | $1,194 | $27,310 | $6,170 | $21,140 |
| 2015 | $1,199 | $27,310 | $6,170 | $21,140 |
| 2014 | $1,205 | $27,310 | $6,170 | $21,140 |
| 2013 | $1,288 | $27,780 | $5,800 | $21,980 |
Source: Public Records
Map
Nearby Homes
- 12 3rd Ave
- 12 Third Ave
- 304 N Gay St
- 208 E Burgess St
- 403 N Mulberry St
- 608 N Gay St
- 22 E Gamber St
- 213 Coshocton Ave
- 607 N Mulberry St
- 0 W Pleasant St
- 418 E Pleasant St
- 111 Potwin St
- 600 1/2 E Chestnut St
- 600 E Chestnut St Unit 1/2
- 649 Howard St
- 655 Howard St
- 501 Oak St
- 203 S Center St
- 0 Miami St
- 332 Wooster Rd
Your Personal Tour Guide
Ask me questions while you tour the home.