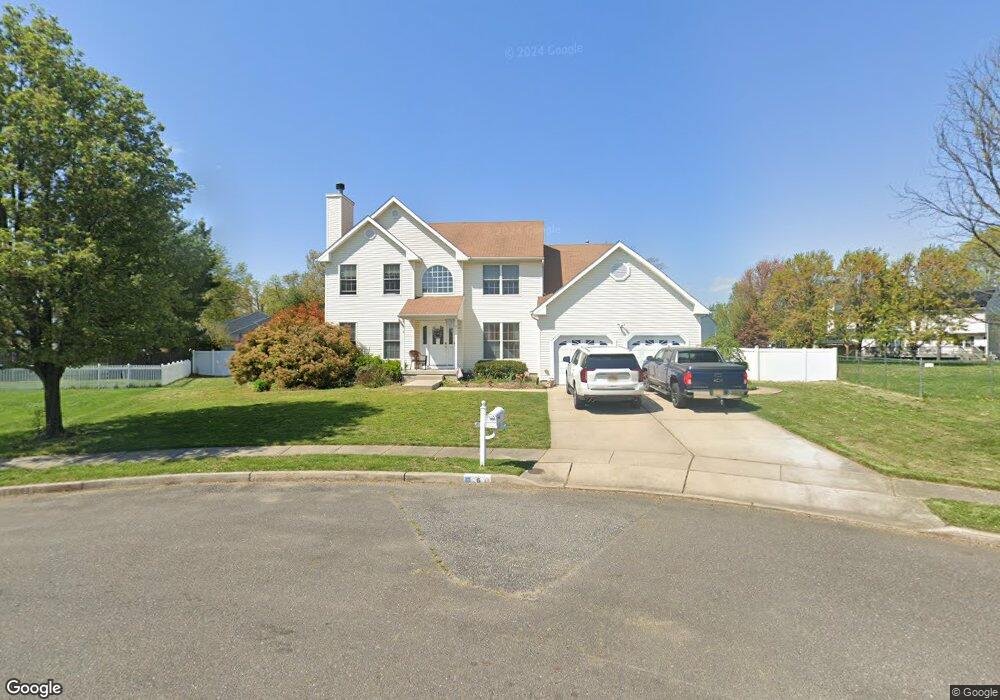
6 Toby Wells Ct Riverside, NJ 08075
Estimated Value: $594,285 - $606,000
4
Beds
3
Baths
2,380
Sq Ft
$252/Sq Ft
Est. Value
About This Home
This home is located at 6 Toby Wells Ct, Riverside, NJ 08075 and is currently estimated at $599,821, approximately $252 per square foot. 6 Toby Wells Ct is a home located in Burlington County with nearby schools including Millbridge Elementary School, Delran Intermediate School, and Delran Middle School.
Ownership History
Date
Name
Owned For
Owner Type
Purchase Details
Closed on
Nov 2, 2016
Sold by
Fisher Louis J
Bought by
Rogers Myla E and Rogers Christopher J
Current Estimated Value
Purchase Details
Closed on
Feb 22, 2008
Sold by
Fisher Jeanne M and Fisher Louis J
Bought by
Fisher Louis J
Home Financials for this Owner
Home Financials are based on the most recent Mortgage that was taken out on this home.
Original Mortgage
$348,000
Interest Rate
5.57%
Mortgage Type
Purchase Money Mortgage
Purchase Details
Closed on
Dec 21, 2001
Sold by
Just Right Construction Llc
Bought by
Fisher Louis J and Fisher Jeanne M
Home Financials for this Owner
Home Financials are based on the most recent Mortgage that was taken out on this home.
Original Mortgage
$225,000
Interest Rate
7.13%
Create a Home Valuation Report for This Property
The Home Valuation Report is an in-depth analysis detailing your home's value as well as a comparison with similar homes in the area
Home Values in the Area
Average Home Value in this Area
Purchase History
| Date | Buyer | Sale Price | Title Company |
|---|---|---|---|
| Rogers Myla E | $305,000 | None Available | |
| Fisher Louis J | -- | Direct Title Corp | |
| Fisher Louis J | $225,000 | -- |
Source: Public Records
Mortgage History
| Date | Status | Borrower | Loan Amount |
|---|---|---|---|
| Previous Owner | Fisher Louis J | $348,000 | |
| Previous Owner | Fisher Louis J | $225,000 |
Source: Public Records
Tax History
| Year | Tax Paid | Tax Assessment Tax Assessment Total Assessment is a certain percentage of the fair market value that is determined by local assessors to be the total taxable value of land and additions on the property. | Land | Improvement |
|---|---|---|---|---|
| 2025 | $12,640 | $317,900 | $75,900 | $242,000 |
| 2024 | $12,525 | $317,900 | $75,900 | $242,000 |
| 2023 | $12,525 | $317,900 | $75,900 | $242,000 |
| 2022 | $12,363 | $317,900 | $75,900 | $242,000 |
| 2021 | $12,369 | $317,900 | $75,900 | $242,000 |
| 2020 | $12,344 | $317,900 | $75,900 | $242,000 |
| 2019 | $12,230 | $317,900 | $75,900 | $242,000 |
| 2018 | $12,026 | $317,900 | $75,900 | $242,000 |
| 2017 | $11,731 | $315,100 | $75,900 | $239,200 |
| 2016 | $11,558 | $315,100 | $75,900 | $239,200 |
| 2015 | $11,366 | $315,100 | $75,900 | $239,200 |
| 2014 | $10,871 | $315,100 | $75,900 | $239,200 |
Source: Public Records
Map
Nearby Homes
- 415 S Chester Ave
- 830 Drexel Ave
- 820 S Chester Ave
- 412 Lippincott Ave
- 409 Lippincott Ave
- 315 Rancocas Ave
- 808 Delaware Ave
- 0 Delaware Ave Unit NJBL2106244
- 423 Delaware Ave
- 227 Heulings Ave
- 232 Cleveland Ave
- 500 Arndt Ave
- 116 Lippincott Ave
- 705 Arndt Ave
- 14 Montclair Dr
- 133 Heulings Ave
- 804 S Fairview St
- 910 S Fairview St
- 10 Yansick Dr
- 38 E Hancock St
Your Personal Tour Guide
Ask me questions while you tour the home.