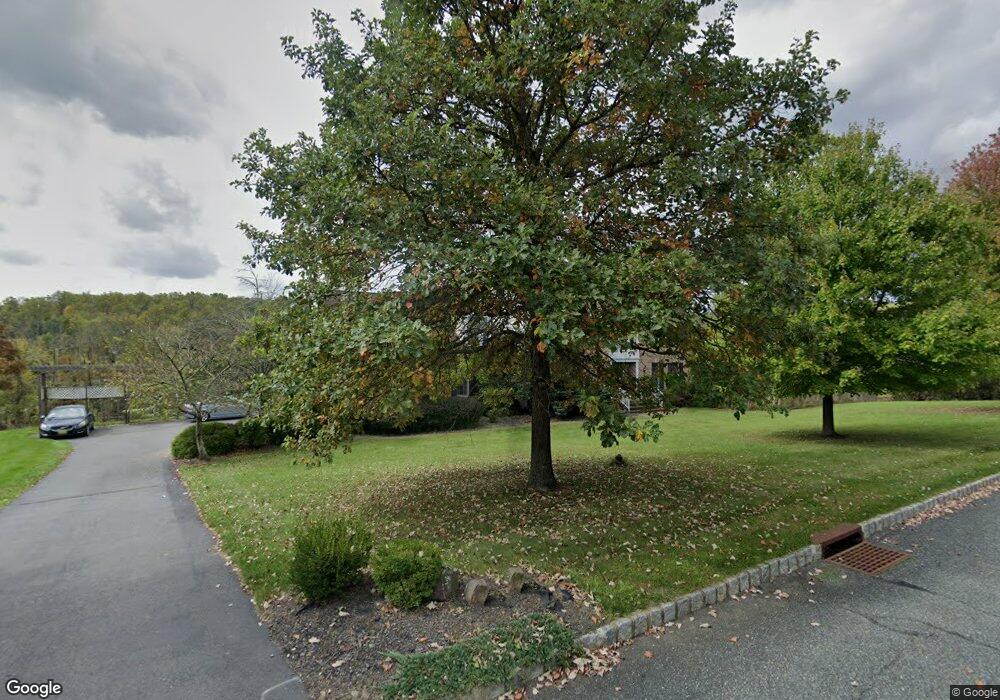
6 Turtle Ct Flemington, NJ 08822
Estimated Value: $1,077,649 - $1,156,000
4
Beds
4
Baths
4,118
Sq Ft
$270/Sq Ft
Est. Value
About This Home
This home is located at 6 Turtle Ct, Flemington, NJ 08822 and is currently estimated at $1,111,162, approximately $269 per square foot. 6 Turtle Ct is a home located in Hunterdon County with nearby schools including Robert Hunter Elementary School, Reading Fleming Intermediate School, and J.P. Case Middle School.
Ownership History
Date
Name
Owned For
Owner Type
Purchase Details
Closed on
Jul 9, 2012
Sold by
Dahl Kristian K and Dahl Jeanette E
Bought by
Dahl Kristian K and Dahl Jeanett E
Current Estimated Value
Home Financials for this Owner
Home Financials are based on the most recent Mortgage that was taken out on this home.
Original Mortgage
$250,000
Outstanding Balance
$172,816
Interest Rate
3.7%
Mortgage Type
New Conventional
Estimated Equity
$938,346
Purchase Details
Closed on
Sep 17, 2008
Sold by
Capawana Anthony and Capawana Adriana
Bought by
Lu Gangyi and Yu Dongq Ing
Home Financials for this Owner
Home Financials are based on the most recent Mortgage that was taken out on this home.
Original Mortgage
$500,000
Outstanding Balance
$120,930
Interest Rate
6.41%
Mortgage Type
Stand Alone First
Estimated Equity
$990,232
Purchase Details
Closed on
Sep 13, 2002
Sold by
Calton Homes Llc
Bought by
Capawana Anthony and Capawana Adriana
Home Financials for this Owner
Home Financials are based on the most recent Mortgage that was taken out on this home.
Original Mortgage
$280,000
Interest Rate
6.36%
Create a Home Valuation Report for This Property
The Home Valuation Report is an in-depth analysis detailing your home's value as well as a comparison with similar homes in the area
Home Values in the Area
Average Home Value in this Area
Purchase History
| Date | Buyer | Sale Price | Title Company |
|---|---|---|---|
| Dahl Kristian K | -- | None Available | |
| Lu Gangyi | $650,000 | Commonwealth | |
| Capawana Anthony | $584,534 | -- |
Source: Public Records
Mortgage History
| Date | Status | Borrower | Loan Amount |
|---|---|---|---|
| Open | Dahl Kristian K | $250,000 | |
| Open | Lu Gangyi | $500,000 | |
| Previous Owner | Capawana Anthony | $280,000 |
Source: Public Records
Tax History
| Year | Tax Paid | Tax Assessment Tax Assessment Total Assessment is a certain percentage of the fair market value that is determined by local assessors to be the total taxable value of land and additions on the property. | Land | Improvement |
|---|---|---|---|---|
| 2025 | $19,650 | $678,300 | $220,000 | $458,300 |
| 2024 | $18,477 | $678,300 | $220,000 | $458,300 |
Source: Public Records
Map
Nearby Homes
- 1 Oak Grove Rd
- 75 Featherbed Ln
- 73 Featherbed Ln
- 33 Featherbed Ln
- 31 Cherryville Hollow Rd
- 57 Featherbed Ln
- 32 Cherryville Hollow Rd
- 128 Old Croton Rd
- 0 Hardscrabble Hill Rd
- 4 Ashton Ct
- 85 Cherryville Hollow Rd
- 23 Valley View Dr
- 20 Chesterfield Ct
- 28 Old Clinton Rd
- 107 Oak Grove Rd
- 13 Grandview Cir
- 312 George Wilson Blvd
- 10 Red Robin Way
- 12 Corcoran St
- 92 Park Ave
Your Personal Tour Guide
Ask me questions while you tour the home.