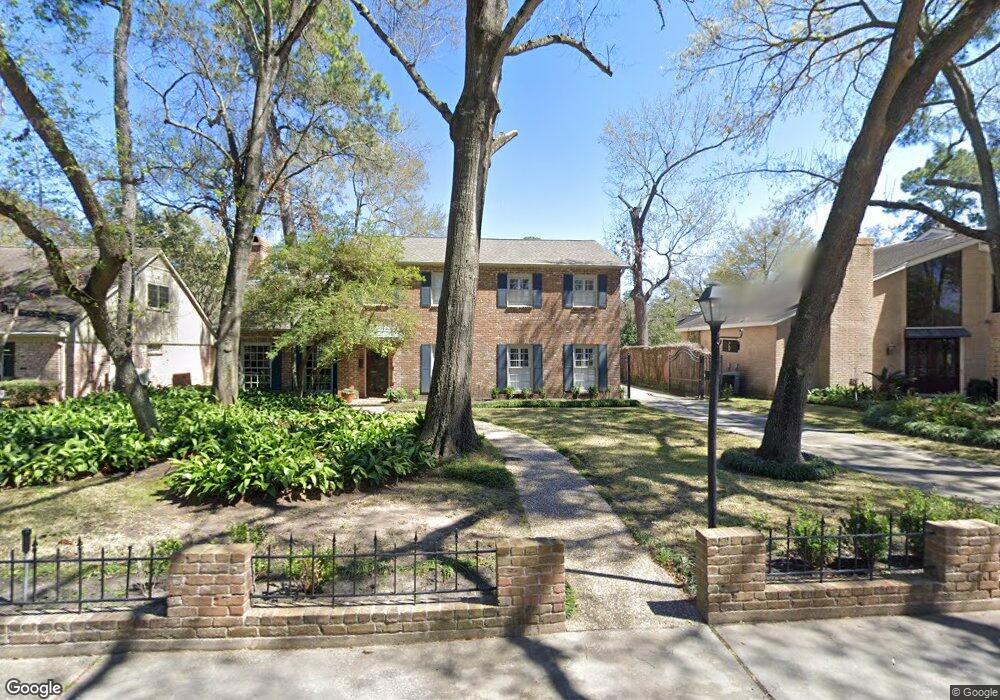
6 Twin Circle Dr Houston, TX 77042
Briar Forest NeighborhoodEstimated Value: $897,000 - $1,037,000
4
Beds
3
Baths
3,553
Sq Ft
$265/Sq Ft
Est. Value
About This Home
This home is located at 6 Twin Circle Dr, Houston, TX 77042 and is currently estimated at $940,828, approximately $264 per square foot. 6 Twin Circle Dr is a home located in Harris County with nearby schools including Walnut Bend Elementary School, Paul Revere Middle School, and Westside High School.
Ownership History
Date
Name
Owned For
Owner Type
Purchase Details
Closed on
Mar 5, 2007
Sold by
Nash Gallagher Cheryl and Nash Cheryl Hamilton
Bought by
Gallagher Michael S
Current Estimated Value
Home Financials for this Owner
Home Financials are based on the most recent Mortgage that was taken out on this home.
Original Mortgage
$352,000
Outstanding Balance
$148,999
Interest Rate
6.3%
Mortgage Type
Credit Line Revolving
Estimated Equity
$791,829
Purchase Details
Closed on
Sep 20, 1993
Sold by
Preng Richard J and Preng Kathryn W
Bought by
Nash John Harris and Nash Cheryl Hamilton
Home Financials for this Owner
Home Financials are based on the most recent Mortgage that was taken out on this home.
Original Mortgage
$285,300
Interest Rate
7.11%
Create a Home Valuation Report for This Property
The Home Valuation Report is an in-depth analysis detailing your home's value as well as a comparison with similar homes in the area
Home Values in the Area
Average Home Value in this Area
Purchase History
| Date | Buyer | Sale Price | Title Company |
|---|---|---|---|
| Gallagher Michael S | -- | Fidelity National Title | |
| Nash John Harris | -- | -- |
Source: Public Records
Mortgage History
| Date | Status | Borrower | Loan Amount |
|---|---|---|---|
| Open | Gallagher Michael S | $352,000 | |
| Previous Owner | Nash John Harris | $285,300 |
Source: Public Records
Tax History
| Year | Tax Paid | Tax Assessment Tax Assessment Total Assessment is a certain percentage of the fair market value that is determined by local assessors to be the total taxable value of land and additions on the property. | Land | Improvement |
|---|---|---|---|---|
| 2025 | $12,329 | $825,469 | $452,318 | $373,151 |
| 2024 | $12,329 | $787,059 | $452,318 | $334,741 |
| 2023 | $12,329 | $814,819 | $452,318 | $362,501 |
| 2022 | $12,946 | $782,607 | $452,318 | $330,289 |
| 2021 | $16,500 | $687,658 | $452,318 | $235,340 |
| 2020 | $16,392 | $676,925 | $452,318 | $224,607 |
| 2019 | $16,866 | $666,505 | $452,318 | $214,187 |
| 2018 | $14,663 | $735,609 | $241,236 | $494,373 |
| 2017 | $17,773 | $735,609 | $241,236 | $494,373 |
| 2016 | $16,157 | $735,609 | $241,236 | $494,373 |
| 2015 | $10,737 | $742,639 | $241,236 | $501,403 |
| 2014 | $10,737 | $550,058 | $241,236 | $308,822 |
Source: Public Records
Map
Nearby Homes
- 10118 Briar Rose Dr
- 10324 Briar Forest Dr Unit 28
- 10252 Longmont Dr Unit 45/4
- 810 Remington Glade Dr
- 10240 Longmont Dr Unit 48/1
- 10355 Longmont Dr Unit 35
- 10331 Lynbrook Hollow St
- 10014 Del Monte Dr
- 1641 W Sam Houston Pkwy S
- 1635 W Sam Houston Pkwy S
- 1691 W Sam Houston Pkwy S
- 10103 Pine Forest Rd
- 10303 Chevy Chase Dr
- 1811 Briarpark Dr
- 10122 Pine Forest Rd
- 10106 Meadow Lake Ln
- 21 W Rivercrest Dr
- 10034 Meadow Lake Ln
- 2219 Briar Branch Dr
- 10218 Burgoyne Rd
- 5 Twin Circle Dr
- 7 Twin Circle Dr
- 1206 Briarbrook Dr
- 8 Twin Circle Dr
- 4 Twin Circle Dr
- 1202 Briarbrook Dr
- 1214 Briarbrook Dr
- 1 Twin Circle Dr
- 2 Twin Circle Dr
- 1110 Briarbrook Dr
- 9 Twin Circle Dr
- 10121 Valley Forge Dr
- 10119 Valley Forge Dr
- 10119 Valley Forge Dr Unit 29
- 10123 Valley Forge Dr
- 10117 Valley Forge Dr
- 10125 Valley Forge Dr
- 14 Twin Circle Dr
- 3 Twin Circle Dr
- 10127 Valley Forge Dr
Your Personal Tour Guide
Ask me questions while you tour the home.