Estimated Value: $655,020 - $781,000
4
Beds
2
Baths
1,498
Sq Ft
$482/Sq Ft
Est. Value
About This Home
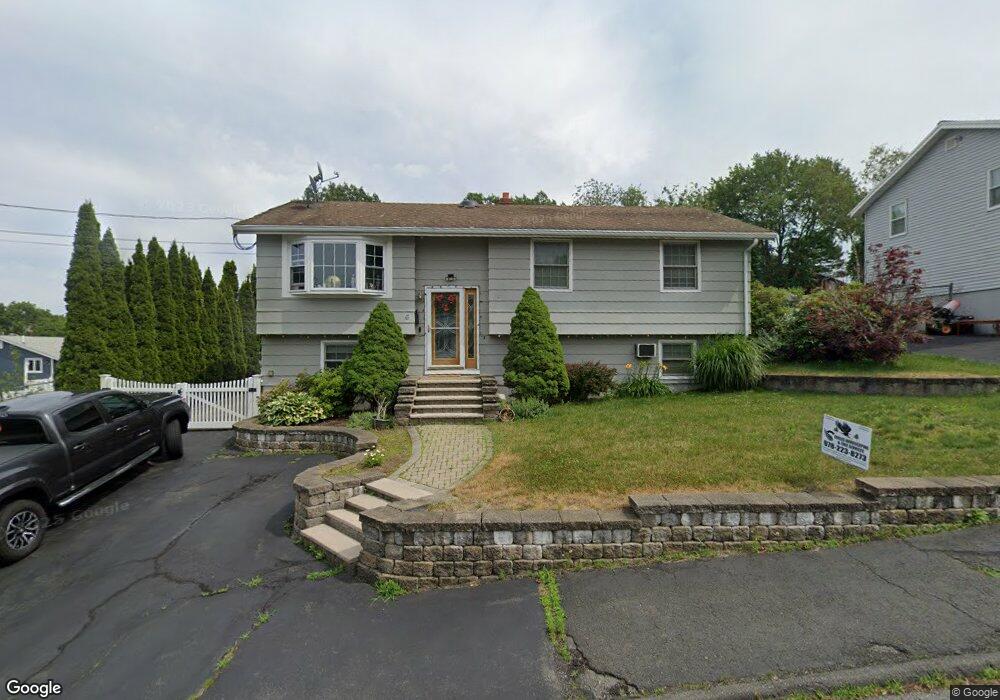
This home is located at 6 Ugo Rd, Salem, MA 01970 and is currently estimated at $722,005, approximately $481 per square foot. 6 Ugo Rd is a home located in Essex County with nearby schools including Witchcraft Heights Elementary School, Horace Mann Laboratory, and Saltonstall School.
Ownership History
Date
Name
Owned For
Owner Type
Purchase Details
Closed on
Oct 23, 2009
Sold by
Alves Tony and Cogliani Jennifer
Bought by
Gonzales Antonio C
Current Estimated Value
Home Financials for this Owner
Home Financials are based on the most recent Mortgage that was taken out on this home.
Original Mortgage
$343,660
Outstanding Balance
$224,519
Interest Rate
5.09%
Mortgage Type
Purchase Money Mortgage
Estimated Equity
$497,486
Purchase Details
Closed on
Jun 9, 2003
Sold by
Benson George O and Benson Mary A
Bought by
Alves Tony and Cogliani Jennifer
Home Financials for this Owner
Home Financials are based on the most recent Mortgage that was taken out on this home.
Original Mortgage
$297,000
Interest Rate
5.83%
Mortgage Type
Purchase Money Mortgage
Purchase Details
Closed on
Jun 2, 1992
Sold by
Shyavitz Robert
Bought by
Benson George O and Benson Mary A
Create a Home Valuation Report for This Property
The Home Valuation Report is an in-depth analysis detailing your home's value as well as a comparison with similar homes in the area
Home Values in the Area
Average Home Value in this Area
Purchase History
| Date | Buyer | Sale Price | Title Company |
|---|---|---|---|
| Gonzales Antonio C | $350,000 | -- | |
| Alves Tony | $317,000 | -- | |
| Benson George O | $143,000 | -- |
Source: Public Records
Mortgage History
| Date | Status | Borrower | Loan Amount |
|---|---|---|---|
| Open | Benson George O | $343,660 | |
| Previous Owner | Benson George O | $297,000 | |
| Previous Owner | Benson George O | $98,900 |
Source: Public Records
Tax History Compared to Growth
Tax History
| Year | Tax Paid | Tax Assessment Tax Assessment Total Assessment is a certain percentage of the fair market value that is determined by local assessors to be the total taxable value of land and additions on the property. | Land | Improvement |
|---|---|---|---|---|
| 2025 | $6,714 | $592,100 | $255,100 | $337,000 |
| 2024 | $6,700 | $576,600 | $240,800 | $335,800 |
| 2023 | $6,478 | $517,800 | $219,200 | $298,600 |
| 2022 | $6,065 | $457,700 | $201,200 | $256,500 |
| 2021 | $5,880 | $426,100 | $186,900 | $239,200 |
| 2020 | $6,011 | $416,000 | $183,300 | $232,700 |
| 2019 | $5,765 | $381,800 | $172,500 | $209,300 |
| 2018 | $5,509 | $358,200 | $161,000 | $197,200 |
| 2017 | $5,281 | $333,000 | $150,900 | $182,100 |
| 2016 | $5,218 | $333,000 | $150,900 | $182,100 |
| 2015 | $4,933 | $300,600 | $133,000 | $167,600 |
Source: Public Records
Map
Nearby Homes
- 4 Ugo Rd
- 24 Buena Vista Ave
- 26 Buena Vista Ave
- 31 Outlook Ave
- 33 Outlook Ave
- 28 Buena Vista Ave
- 2 Ugo Rd
- 3 Ugo Rd
- 7 Ugo Rd
- 5 Ugo Rd
- 1 Ugo Rd
- 30 Buena Vista Ave
- 35 Outlook Ave
- 27 Buena Vista Ave
- 25 Buena Vista Ave
- 29 Buena Vista Ave
- 23 Buena Vista Ave
- 34 Outlook Ave
- 32 Buena Vista Ave
- 20 Buena Vista Ave