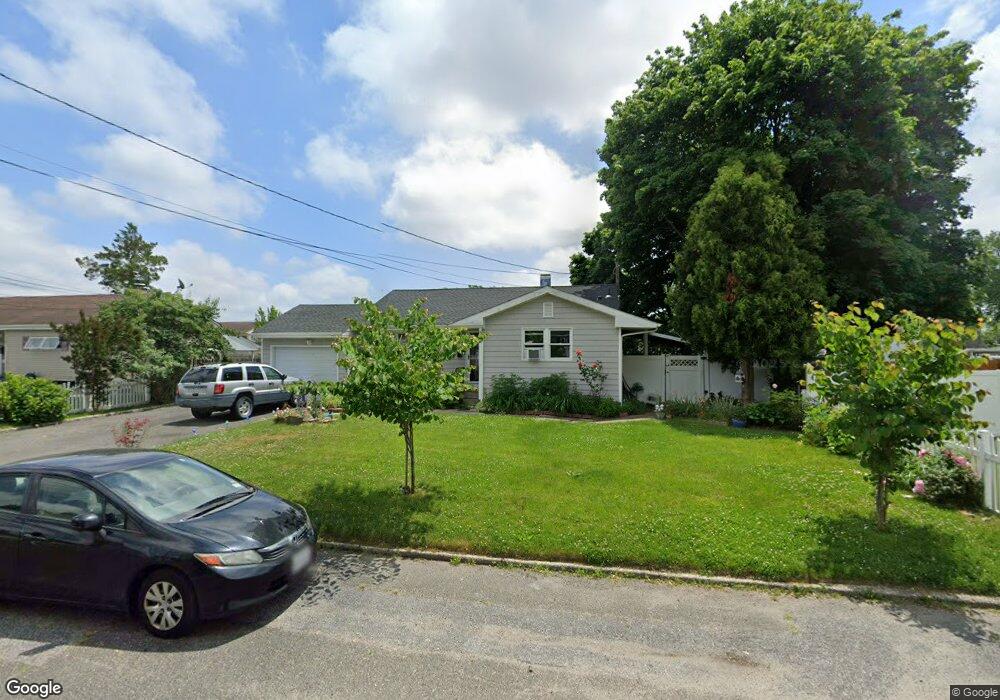
6 Van Buren St Brentwood, NY 11717
Estimated Value: $506,962 - $703,000
--
Bed
--
Bath
--
Sq Ft
7,405
Sq Ft Lot
About This Home
This home is located at 6 Van Buren St, Brentwood, NY 11717 and is currently estimated at $607,241. 6 Van Buren St is a home located in Suffolk County with nearby schools including MDQ Academy.
Ownership History
Date
Name
Owned For
Owner Type
Purchase Details
Closed on
Jan 27, 2019
Sold by
Stanely Lynette M
Bought by
Sidor Cindy M and Stanley Lynette M
Current Estimated Value
Purchase Details
Closed on
Jun 14, 2004
Sold by
Cantor Linda Friedman
Bought by
Stanley Lynette M
Home Financials for this Owner
Home Financials are based on the most recent Mortgage that was taken out on this home.
Original Mortgage
$233,500
Interest Rate
6.3%
Mortgage Type
Purchase Money Mortgage
Create a Home Valuation Report for This Property
The Home Valuation Report is an in-depth analysis detailing your home's value as well as a comparison with similar homes in the area
Home Values in the Area
Average Home Value in this Area
Purchase History
| Date | Buyer | Sale Price | Title Company |
|---|---|---|---|
| Sidor Cindy M | -- | -- | |
| Stanley Lynette M | $260,000 | Titlewaves Title Agency Llc |
Source: Public Records
Mortgage History
| Date | Status | Borrower | Loan Amount |
|---|---|---|---|
| Previous Owner | Stanley Lynette M | $233,500 |
Source: Public Records
Tax History Compared to Growth
Tax History
| Year | Tax Paid | Tax Assessment Tax Assessment Total Assessment is a certain percentage of the fair market value that is determined by local assessors to be the total taxable value of land and additions on the property. | Land | Improvement |
|---|---|---|---|---|
| 2024 | $7,176 | $31,300 | $7,100 | $24,200 |
| 2023 | $7,176 | $31,300 | $7,100 | $24,200 |
| 2022 | $5,284 | $31,300 | $7,100 | $24,200 |
| 2021 | $5,284 | $31,300 | $7,100 | $24,200 |
| 2020 | $6,580 | $31,300 | $7,100 | $24,200 |
| 2019 | $6,580 | $0 | $0 | $0 |
| 2018 | -- | $31,300 | $7,100 | $24,200 |
| 2017 | $5,329 | $31,300 | $7,100 | $24,200 |
| 2016 | $5,279 | $31,300 | $7,100 | $24,200 |
| 2015 | -- | $31,300 | $7,100 | $24,200 |
| 2014 | -- | $31,300 | $7,100 | $24,200 |
Source: Public Records
Map
Nearby Homes