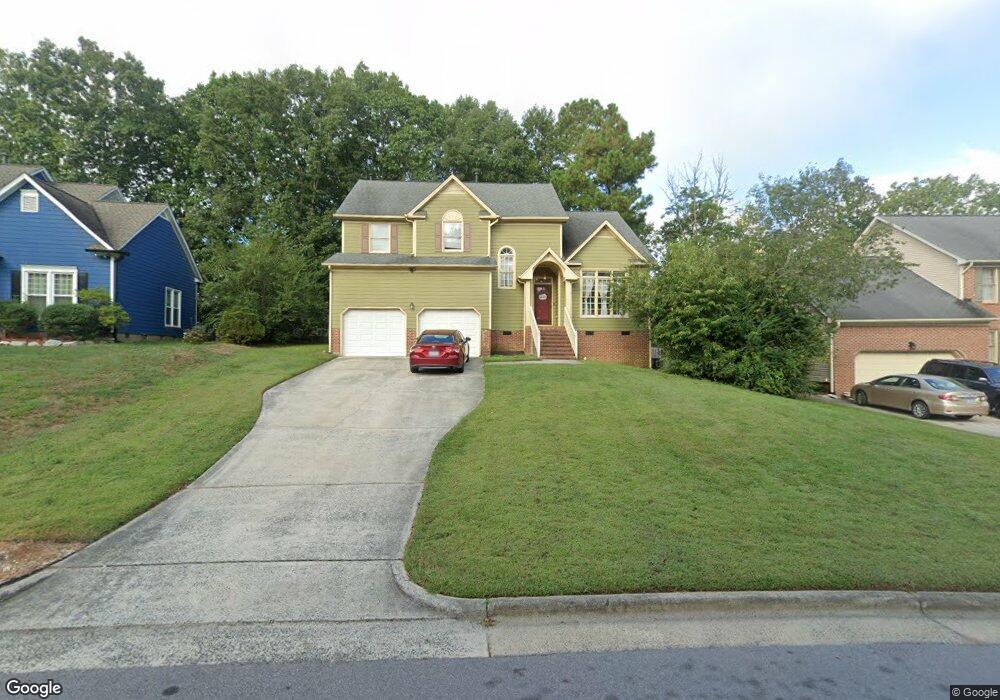
6 Vestrial Ln Durham, NC 27703
Eastern Durham NeighborhoodEstimated Value: $428,820 - $436,000
4
Beds
3
Baths
2,318
Sq Ft
$186/Sq Ft
Est. Value
About This Home
This home is located at 6 Vestrial Ln, Durham, NC 27703 and is currently estimated at $432,205, approximately $186 per square foot. 6 Vestrial Ln is a home located in Durham County with nearby schools including Oak Grove Elementary, John W Neal Middle School, and Southern School of Energy & Sustainability.
Ownership History
Date
Name
Owned For
Owner Type
Purchase Details
Closed on
Feb 21, 2011
Sold by
U S Bank National Association
Bought by
Pamplin Roscoe L and Pamplin Ericka L
Current Estimated Value
Home Financials for this Owner
Home Financials are based on the most recent Mortgage that was taken out on this home.
Original Mortgage
$160,886
Outstanding Balance
$110,975
Interest Rate
4.95%
Mortgage Type
VA
Estimated Equity
$321,230
Purchase Details
Closed on
Jul 27, 2010
Sold by
Harper Deborah
Bought by
U S Bank National Association
Purchase Details
Closed on
Jun 1, 2006
Sold by
Haj Piroozbakht Gholam Abbas and Azadi Razieh
Bought by
Harper Deborah
Home Financials for this Owner
Home Financials are based on the most recent Mortgage that was taken out on this home.
Original Mortgage
$165,600
Interest Rate
8.87%
Mortgage Type
Fannie Mae Freddie Mac
Create a Home Valuation Report for This Property
The Home Valuation Report is an in-depth analysis detailing your home's value as well as a comparison with similar homes in the area
Home Values in the Area
Average Home Value in this Area
Purchase History
| Date | Buyer | Sale Price | Title Company |
|---|---|---|---|
| Pamplin Roscoe L | $157,500 | None Available | |
| U S Bank National Association | $128,152 | None Available | |
| Harper Deborah | $207,000 | None Available |
Source: Public Records
Mortgage History
| Date | Status | Borrower | Loan Amount |
|---|---|---|---|
| Open | Pamplin Roscoe L | $160,886 | |
| Previous Owner | Harper Deborah | $165,600 |
Source: Public Records
Tax History Compared to Growth
Tax History
| Year | Tax Paid | Tax Assessment Tax Assessment Total Assessment is a certain percentage of the fair market value that is determined by local assessors to be the total taxable value of land and additions on the property. | Land | Improvement |
|---|---|---|---|---|
| 2025 | $4,100 | $413,582 | $62,239 | $351,343 |
| 2024 | $3,332 | $238,866 | $45,525 | $193,341 |
| 2023 | $3,129 | $238,866 | $45,525 | $193,341 |
| 2022 | $3,057 | $238,866 | $45,525 | $193,341 |
| 2021 | $3,043 | $238,866 | $45,525 | $193,341 |
| 2020 | $2,971 | $238,866 | $45,525 | $193,341 |
| 2019 | $2,971 | $238,866 | $45,525 | $193,341 |
| 2018 | $2,789 | $205,571 | $33,385 | $172,186 |
| 2017 | $2,768 | $205,571 | $33,385 | $172,186 |
| 2016 | $2,675 | $205,571 | $33,385 | $172,186 |
| 2015 | $2,870 | $207,349 | $34,391 | $172,958 |
| 2014 | $2,870 | $207,349 | $34,391 | $172,958 |
Source: Public Records
Map
Nearby Homes
- 615 Southshore Pkwy
- 16 Vestrial Ln
- 715 Southshore Pkwy
- 128 Leacroft Way
- 503 Bellmeade Bay Dr
- 537 Crossview Ln
- 1 Kings Grant Ct
- 519 Keith St
- 208 Lick Creek Ln
- 2117 Fletchers Ridge Dr
- 301 Sylvias Ct
- 622 Sherron Rd
- 610 Sherron Rd
- 6 Dawson Ct
- 30 Plumleaf Ln
- 1013 Blackthorn Ln
- 2002 Cross Bones Blvd Unit 36
- 807 Outlaw Ave Unit 19
- 2011 Cross Bones Blvd Unit 41
- 1009 Shovelhead Dr Unit 5
- 4 Vestrial Ln
- 8 Vestrial Ln
- 4 Cameroons Place
- 6 Cameroons Place
- 1008 Gunston Ln
- 2 Vestrial Ln
- 2 Trescott Dr
- 8 Cameroons Place
- 1 Trescott Dr
- 1001 Gunston Ln
- 1005 Gunston Ln
- 4 Trescott Dr
- 3 Trescott Dr
- 9 Vestrial Ln
- 9 Cameroons Place
- 1007 Gunston Ln
- 3 Cameroons Place
- 1009 Gunston Ln
- 1 Cameroons Place
- 5 Trescott Dr