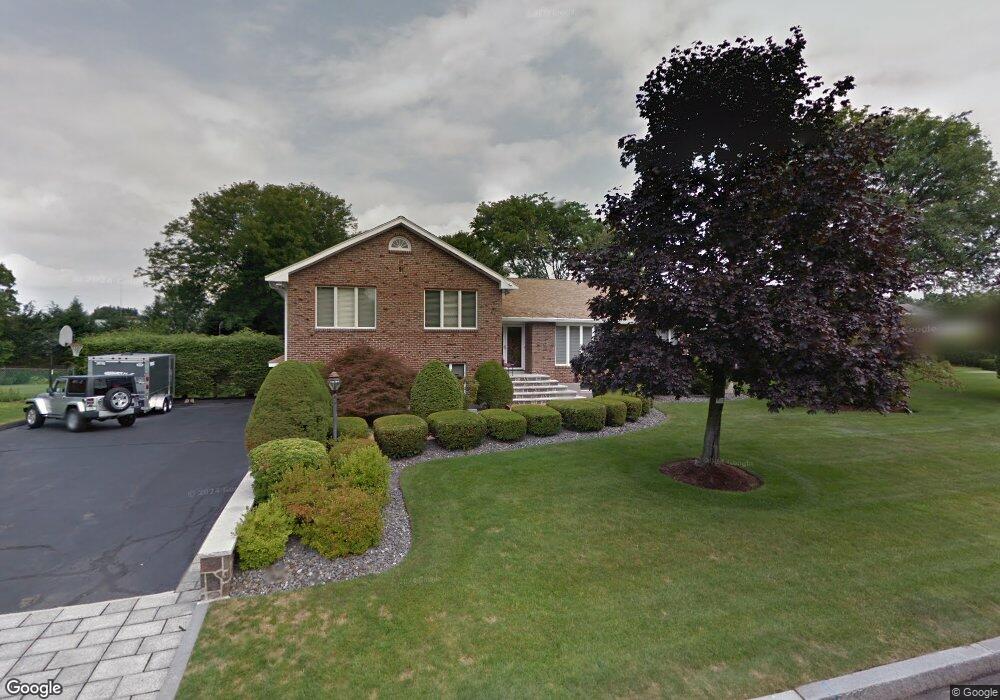
6 Viking Rd Winchester, MA 01890
West Side NeighborhoodEstimated Value: $1,463,000 - $1,975,000
3
Beds
4
Baths
3,985
Sq Ft
$449/Sq Ft
Est. Value
About This Home
This home is located at 6 Viking Rd, Winchester, MA 01890 and is currently estimated at $1,787,588, approximately $448 per square foot. 6 Viking Rd is a home located in Middlesex County with nearby schools including Vinson-Owen Elementary School, McCall Middle School, and Winchester High School.
Ownership History
Date
Name
Owned For
Owner Type
Purchase Details
Closed on
Jan 31, 2024
Sold by
Bonacorso John J and Bonacorso Domenica
Bought by
John J Bonacorso T J and John Bonacorso
Current Estimated Value
Purchase Details
Closed on
Sep 11, 1985
Bought by
Bonacorso John J and Bonacorso Domenica
Create a Home Valuation Report for This Property
The Home Valuation Report is an in-depth analysis detailing your home's value as well as a comparison with similar homes in the area
Home Values in the Area
Average Home Value in this Area
Purchase History
| Date | Buyer | Sale Price | Title Company |
|---|---|---|---|
| John J Bonacorso T J | -- | None Available | |
| Bonacorso John J | -- | -- |
Source: Public Records
Mortgage History
| Date | Status | Borrower | Loan Amount |
|---|---|---|---|
| Previous Owner | Bonacorso John J | $417,000 | |
| Previous Owner | Bonacorso John J | $322,000 |
Source: Public Records
Tax History Compared to Growth
Tax History
| Year | Tax Paid | Tax Assessment Tax Assessment Total Assessment is a certain percentage of the fair market value that is determined by local assessors to be the total taxable value of land and additions on the property. | Land | Improvement |
|---|---|---|---|---|
| 2025 | $175 | $1,576,100 | $1,001,300 | $574,800 |
| 2024 | $16,688 | $1,472,900 | $921,300 | $551,600 |
| 2023 | $15,047 | $1,275,200 | $761,300 | $513,900 |
| 2022 | $15,664 | $1,252,100 | $701,100 | $551,000 |
| 2021 | $14,781 | $1,152,100 | $601,100 | $551,000 |
| 2020 | $14,275 | $1,152,100 | $601,100 | $551,000 |
| 2019 | $13,468 | $1,112,100 | $561,100 | $551,000 |
| 2018 | $4,671 | $1,067,100 | $516,100 | $551,000 |
| 2017 | $12,548 | $1,021,800 | $516,100 | $505,700 |
| 2016 | $11,306 | $968,000 | $516,100 | $451,900 |
| 2015 | $10,559 | $869,800 | $450,100 | $419,700 |
| 2014 | $10,643 | $840,700 | $431,100 | $409,600 |
Source: Public Records
Map
Nearby Homes