Estimated Value: $352,000 - $402,000
--
Bed
3
Baths
2,387
Sq Ft
$155/Sq Ft
Est. Value
About This Home
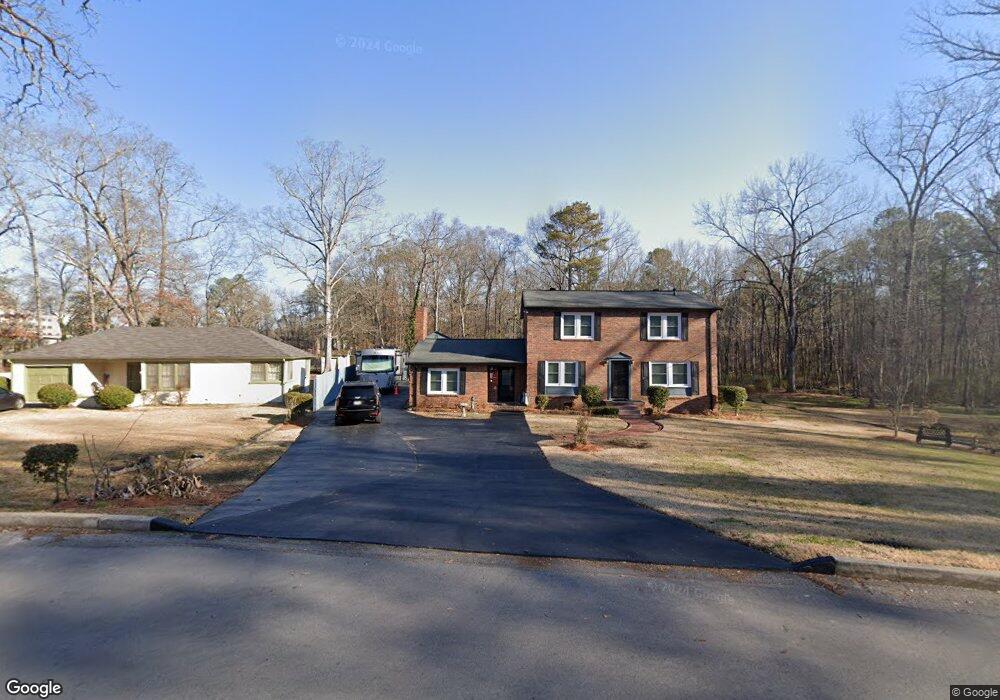
This home is located at 6 Vineland Dr NW, Rome, GA 30165 and is currently estimated at $370,381, approximately $155 per square foot. 6 Vineland Dr NW is a home located in Floyd County with nearby schools including Rome High School.
Ownership History
Date
Name
Owned For
Owner Type
Purchase Details
Closed on
Feb 29, 1988
Sold by
Moore Thos J and Moore Georgia
Bought by
Collins William E and Collins Faith D
Current Estimated Value
Purchase Details
Closed on
Dec 30, 1975
Sold by
Redmon John T
Bought by
Moore Thos J and Moore Georgia
Purchase Details
Closed on
Oct 20, 1972
Sold by
Sandlin Mcdewain
Bought by
Redmon John T
Purchase Details
Closed on
Jan 1, 1901
Bought by
Sandlin Mcdewain
Create a Home Valuation Report for This Property
The Home Valuation Report is an in-depth analysis detailing your home's value as well as a comparison with similar homes in the area
Home Values in the Area
Average Home Value in this Area
Purchase History
| Date | Buyer | Sale Price | Title Company |
|---|---|---|---|
| Collins William E | $85,000 | -- | |
| Moore Thos J | $45,000 | -- | |
| Redmon John T | $27,400 | -- | |
| Sandlin Mcdewain | -- | -- |
Source: Public Records
Tax History Compared to Growth
Tax History
| Year | Tax Paid | Tax Assessment Tax Assessment Total Assessment is a certain percentage of the fair market value that is determined by local assessors to be the total taxable value of land and additions on the property. | Land | Improvement |
|---|---|---|---|---|
| 2024 | $2,958 | $149,315 | $18,480 | $130,835 |
| 2023 | $2,081 | $124,492 | $16,594 | $107,898 |
| 2022 | $2,806 | $102,805 | $13,577 | $89,228 |
| 2021 | $2,663 | $92,252 | $12,446 | $79,806 |
| 2020 | $2,546 | $84,595 | $9,428 | $75,167 |
| 2019 | $2,367 | $75,543 | $9,428 | $66,115 |
| 2018 | $2,290 | $71,129 | $9,428 | $61,701 |
| 2017 | $2,208 | $66,379 | $9,428 | $56,951 |
| 2016 | $2,182 | $64,562 | $9,400 | $55,162 |
| 2015 | $2,071 | $64,562 | $9,400 | $55,162 |
| 2014 | $2,071 | $64,562 | $9,400 | $55,162 |
Source: Public Records
Map
Nearby Homes
- 614 Briarwood Cir NW
- 7 Raymond Ave NW
- 105 Robin St NW
- 808 Charlton St NW
- 4 Colonial Dr NW
- 0 Unbridled Rd Unit 22 23074684
- 124 Sheridan Dr NW
- 23 Sweetspire Dr NW
- 21 Sweetspire Dr NW
- 15 Silverbell Ln
- 9 Shorter Cir SW
- 209 Sherwood Rd SW
- 8 S Hughes St SW
- 1005 N 2nd Ave NW Unit 39
- PEARSON Plan at Shorter Village
- 214 N Elm St NW
- 3 Berckman Ln SW
- 19 Berckman Ln SW
- 8 Vineland Dr NW
- 10 Vineland Dr NW
- 5 Vineland Dr NW
- 7 Vineland Dr NW
- 1 Vineland Dr NW
- 9 Vineland Dr NW
- 15 John Maddox Dr NW
- 14 Vineland Dr NW Unit 10 & 11
- 11 Vineland Dr NW
- 504 Charlton St NW
- 506 Charlton St NW
- 15 Vineland Dr NW
- 508 Charlton St NW
- 0 Charlton St NW Unit 8583290
- 0 Charlton St NW Unit 8521067
- 0 Charlton St NW Unit 8458035
- 0 Charlton St NW Unit 8223069
- 0 Charlton St NW Unit 8091225
- 0 Charlton St NW Unit 8981696
- 0 Charlton St NW Unit 9014112