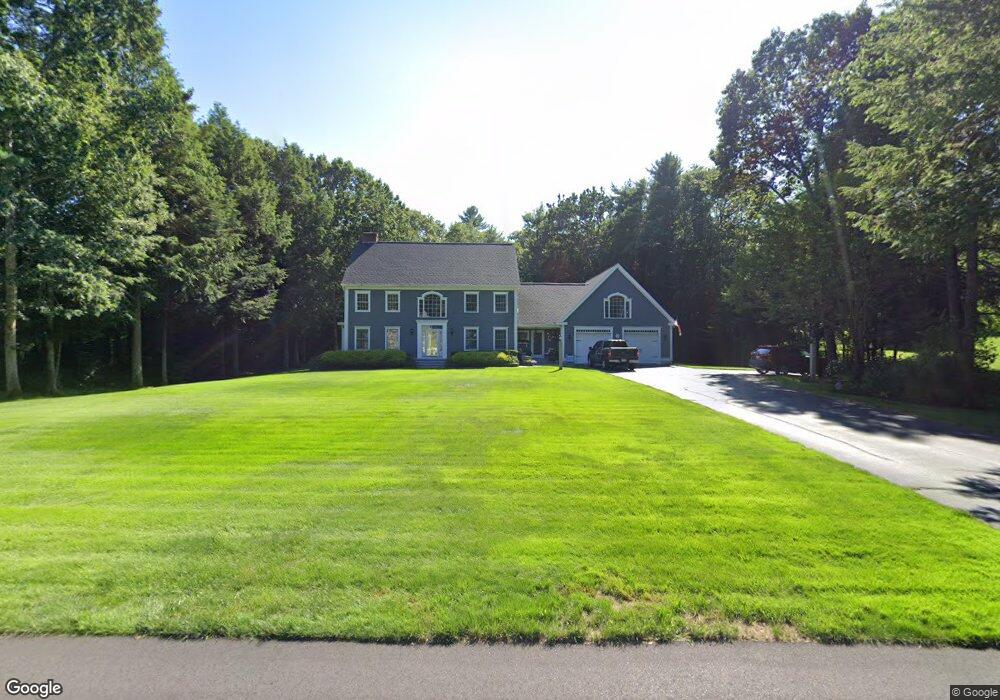
6 Vines Rd Saco, ME 04072
East Saco NeighborhoodEstimated Value: $966,618 - $1,552,000
4
Beds
3
Baths
3,856
Sq Ft
$312/Sq Ft
Est. Value
About This Home
This home is located at 6 Vines Rd, Saco, ME 04072 and is currently estimated at $1,204,905, approximately $312 per square foot. 6 Vines Rd is a home located in York County with nearby schools including C K Burns School, Saco Middle School, and Florence Lombard Christian School.
Ownership History
Date
Name
Owned For
Owner Type
Purchase Details
Closed on
Sep 17, 2015
Sold by
Jackman Barry C
Bought by
Jackman Barry C and Hilaire Lynne S
Current Estimated Value
Home Financials for this Owner
Home Financials are based on the most recent Mortgage that was taken out on this home.
Original Mortgage
$460,800
Outstanding Balance
$362,299
Interest Rate
3.94%
Mortgage Type
Unknown
Estimated Equity
$842,607
Purchase Details
Closed on
Jan 15, 2009
Sold by
Jackman Donna M
Bought by
Jackman Barry C
Home Financials for this Owner
Home Financials are based on the most recent Mortgage that was taken out on this home.
Original Mortgage
$315,000
Interest Rate
5.52%
Mortgage Type
Reverse Mortgage Home Equity Conversion Mortgage
Create a Home Valuation Report for This Property
The Home Valuation Report is an in-depth analysis detailing your home's value as well as a comparison with similar homes in the area
Home Values in the Area
Average Home Value in this Area
Purchase History
| Date | Buyer | Sale Price | Title Company |
|---|---|---|---|
| Jackman Barry C | -- | -- | |
| Jackman Barry C | -- | -- |
Source: Public Records
Mortgage History
| Date | Status | Borrower | Loan Amount |
|---|---|---|---|
| Open | Jackman Barry C | $460,800 | |
| Closed | Jackman Barry C | $315,000 |
Source: Public Records
Tax History
| Year | Tax Paid | Tax Assessment Tax Assessment Total Assessment is a certain percentage of the fair market value that is determined by local assessors to be the total taxable value of land and additions on the property. | Land | Improvement |
|---|---|---|---|---|
| 2024 | $10,588 | $753,600 | $201,100 | $552,500 |
| 2023 | $11,116 | $753,600 | $201,100 | $552,500 |
| 2022 | $9,907 | $540,500 | $153,400 | $387,100 |
| 2021 | $9,542 | $505,400 | $140,700 | $364,700 |
| 2020 | $9,166 | $466,000 | $128,100 | $337,900 |
| 2019 | $9,031 | $466,000 | $128,100 | $337,900 |
| 2018 | $2,726 | $457,600 | $119,700 | $337,900 |
| 2017 | $8,357 | $451,200 | $108,800 | $342,400 |
| 2016 | $8,753 | $450,700 | $107,100 | $343,600 |
| 2015 | $8,345 | $434,200 | $107,100 | $327,100 |
| 2014 | $8,044 | $432,000 | $104,900 | $327,100 |
| 2013 | $8,027 | $432,000 | $104,900 | $327,100 |
Source: Public Records
Map
Nearby Homes
- 30 Vines Rd
- 280 Seaside Ave
- 3 Walker Dr Unit 101
- 4 Walker Dr Unit 101
- 3 Walker Dr Unit 101
- TBD 530 Ferry Rd
- 295 Ferry Rd
- 46 Ferry Ln
- 10 Lower Beach Rd
- 1 Main Ave
- 625 Pool St
- 650 Pool St
- 378 Pool St
- 353 Pool St
- 9 Riverside Ave
- 11 Peabody Ln Unit 101
- 343 Pool St
- 2 Breakwater Way Unit 2
- 163 Temple Ave Unit 163
- 163 Temple Ave
Your Personal Tour Guide
Ask me questions while you tour the home.