Estimated Value: $54,155 - $96,000
--
Bed
1
Bath
816
Sq Ft
$88/Sq Ft
Est. Value
About This Home
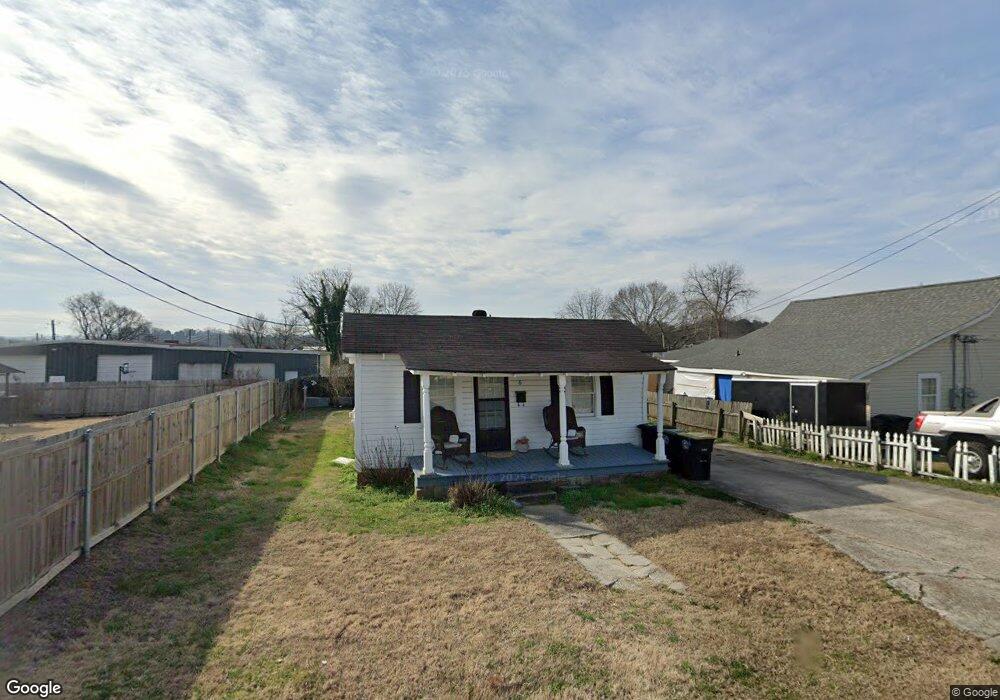
This home is located at 6 W 10th St NW, Rome, GA 30165 and is currently estimated at $71,539, approximately $87 per square foot. 6 W 10th St NW is a home located in Floyd County with nearby schools including Rome High School, St. Mary School, and Darlington School.
Ownership History
Date
Name
Owned For
Owner Type
Purchase Details
Closed on
Oct 24, 1994
Sold by
Mckenzie Lynda Olivia P and Bobbie Kenneth
Bought by
Mckenzie Ralph Jerome
Current Estimated Value
Purchase Details
Closed on
Feb 20, 1989
Sold by
Mckenzie Lynda Olivia P
Bought by
Mckenzie Lynda Olivia P and Bobbie Ke
Purchase Details
Closed on
Nov 18, 1986
Sold by
Phillips Ralph
Bought by
Greer Sarah Ann P Mrs and Greer Lynda O
Purchase Details
Closed on
Aug 16, 1985
Sold by
Phillips Sarah Vivian
Bought by
Phillips Ralph
Purchase Details
Closed on
Jun 28, 1984
Bought by
P and R
Purchase Details
Closed on
Mar 30, 1971
Sold by
Brooks Mrs Odie D
Bought by
Phillips Sarah Vivian
Purchase Details
Closed on
Jul 7, 1964
Sold by
Phillips Sara Vivian
Bought by
Brooks Mrs Odie D
Purchase Details
Closed on
Jan 8, 1964
Sold by
Brooks Odie E
Bought by
Phillips Sara Vivian
Purchase Details
Closed on
Jan 1, 1901
Bought by
Brooks Odie E
Create a Home Valuation Report for This Property
The Home Valuation Report is an in-depth analysis detailing your home's value as well as a comparison with similar homes in the area
Home Values in the Area
Average Home Value in this Area
Purchase History
| Date | Buyer | Sale Price | Title Company |
|---|---|---|---|
| Mckenzie Ralph Jerome | -- | -- | |
| Mckenzie Lynda Olivia P | -- | -- | |
| Greer Sarah Ann P Mrs | -- | -- | |
| Phillips Ralph | -- | -- | |
| P | -- | -- | |
| Phillips Sarah Vivian | -- | -- | |
| Brooks Mrs Odie D | -- | -- | |
| Phillips Sara Vivian | -- | -- | |
| Brooks Odie E | -- | -- |
Source: Public Records
Tax History Compared to Growth
Tax History
| Year | Tax Paid | Tax Assessment Tax Assessment Total Assessment is a certain percentage of the fair market value that is determined by local assessors to be the total taxable value of land and additions on the property. | Land | Improvement |
|---|---|---|---|---|
| 2024 | $559 | $15,404 | $4,158 | $11,246 |
| 2023 | $546 | $12,509 | $3,696 | $8,813 |
| 2022 | $408 | $11,168 | $3,080 | $8,088 |
| 2021 | $343 | $9,231 | $3,080 | $6,151 |
| 2020 | $275 | $7,354 | $2,310 | $5,044 |
| 2019 | $260 | $7,034 | $2,310 | $4,724 |
| 2018 | $247 | $6,670 | $2,310 | $4,360 |
| 2017 | $240 | $6,484 | $2,310 | $4,174 |
| 2016 | $263 | $7,080 | $2,280 | $4,800 |
| 2015 | $243 | $6,933 | $2,280 | $4,653 |
| 2014 | $243 | $6,933 | $2,280 | $4,653 |
Source: Public Records
Map
Nearby Homes
- 1005 N 2nd Ave NW Unit 39
- PEARSON Plan at Shorter Village
- 1018 N 2nd Ave NW
- 0 Unbridled Rd Unit 22 23074684
- 6 Horseleg Creek Rd SW
- 601 W 10th St NE
- 1006 Avenue A NE
- 4 Colonial Dr NW
- 9 Shorter Cir SW
- 204 Oakwood St NW
- 7 Raymond Ave NW
- 209 Sherwood Rd SW
- 17 Rosewood Rd SW
- 101 Hardy Ave SW
- 1 E 3rd Ave Unit 302
- 19 Berckman Ln SW
- 223 Pennington Ave SW
- 14 Vineland Dr NW
- 3 Berckman Ln SW
- 14 Berckman Ln SW
- 936 N 2nd Ave NW
- 925 Desoto Ave NW
- 921 Desoto Ave NW
- 1002 N 2nd Ave NW
- 1003 Desoto Ave NW
- 926 Desoto Ave NW
- 1005 N 2nd Ave NW Unit 35
- 1005 N 2nd Ave NW Unit 34
- 1005 N 2nd Ave NW Unit 22
- 1005 N 2nd Ave NW Unit 24
- 1005 N 2nd Ave NW Unit A
- 1005 N 2nd Ave NW Unit 10
- 1005 N 2nd Ave NW Unit 7
- 1005 N 2nd Ave NW
- 1005 N 2nd Ave NW Unit 37
- 1005 N 2nd Ave NW Unit 31
- 1005 N 2nd Ave NW Unit 30
- 1005 N 2nd Ave NW Unit 27
- 1005 N 2nd Ave NW Unit 26
- 922 Desoto Ave NW