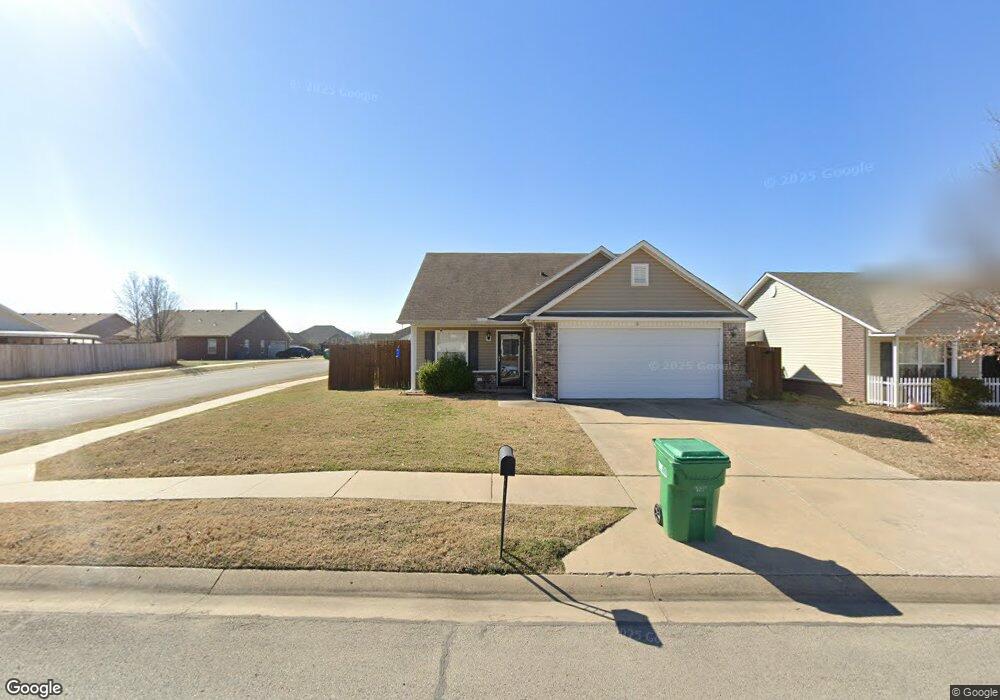
6 W Fairlane Place Sapulpa, OK 74066
Estimated Value: $215,309 - $223,000
3
Beds
2
Baths
1,401
Sq Ft
$156/Sq Ft
Est. Value
About This Home
This home is located at 6 W Fairlane Place, Sapulpa, OK 74066 and is currently estimated at $218,077, approximately $155 per square foot. 6 W Fairlane Place is a home located in Creek County with nearby schools including Lone Star Public School, Eagle Point Christian Academy, and American Christian Academy.
Ownership History
Date
Name
Owned For
Owner Type
Purchase Details
Closed on
Aug 11, 2023
Sold by
Surface Land Investments Llc
Bought by
Gonzalez Cynthia and Dixon Cody Lee
Current Estimated Value
Purchase Details
Closed on
Aug 28, 2017
Sold by
Kinion Chris W
Bought by
Creekmore Peggy J
Home Financials for this Owner
Home Financials are based on the most recent Mortgage that was taken out on this home.
Original Mortgage
$78,000
Interest Rate
3.96%
Mortgage Type
Commercial
Purchase Details
Closed on
Oct 20, 2009
Sold by
Rausch Coleman Ss Llc
Bought by
Kinion Chris W
Home Financials for this Owner
Home Financials are based on the most recent Mortgage that was taken out on this home.
Original Mortgage
$97,000
Interest Rate
5.14%
Mortgage Type
New Conventional
Create a Home Valuation Report for This Property
The Home Valuation Report is an in-depth analysis detailing your home's value as well as a comparison with similar homes in the area
Home Values in the Area
Average Home Value in this Area
Purchase History
| Date | Buyer | Sale Price | Title Company |
|---|---|---|---|
| Gonzalez Cynthia | -- | -- | |
| Creekmore Peggy J | $128,000 | Multiple | |
| Kinion Chris W | $121,500 | -- |
Source: Public Records
Mortgage History
| Date | Status | Borrower | Loan Amount |
|---|---|---|---|
| Closed | Creekmore Peggy J | $78,000 | |
| Previous Owner | Kinion Chris W | $97,000 |
Source: Public Records
Tax History Compared to Growth
Tax History
| Year | Tax Paid | Tax Assessment Tax Assessment Total Assessment is a certain percentage of the fair market value that is determined by local assessors to be the total taxable value of land and additions on the property. | Land | Improvement |
|---|---|---|---|---|
| 2025 | $1,571 | $16,489 | $2,781 | $13,708 |
| 2024 | $1,571 | $16,009 | $2,700 | $13,309 |
| 2023 | $1,571 | $15,543 | $2,700 | $12,843 |
| 2022 | $1,498 | $15,090 | $2,700 | $12,390 |
| 2021 | $1,460 | $14,511 | $2,700 | $11,811 |
| 2020 | $1,705 | $14,579 | $2,700 | $11,879 |
| 2019 | $1,528 | $15,347 | $2,700 | $12,647 |
| 2018 | $1,552 | $15,347 | $2,700 | $12,647 |
| 2017 | $1,510 | $14,866 | $2,850 | $12,016 |
| 2016 | $1,551 | $14,866 | $2,850 | $12,016 |
| 2015 | -- | $14,866 | $2,850 | $12,016 |
| 2014 | -- | $14,580 | $2,340 | $12,240 |
Source: Public Records
Map
Nearby Homes
- 103 E Fairlane Ct
- 19 E Fairlane Ct
- 41 W Fairlane Ct
- 273 W Fairlane Dr
- 209 W Norma St
- 416 W Fairlane Dr Unit A-B
- 2600 S Hickory St
- 1965 S Scott St
- 211 E Wells Blvd
- 13623 S 97th Ave W
- 119 E Ross Ave
- 605 W Mockingbird Ln
- 120 E Burnham Ave
- 1915 S Muskogee St
- 1424 S Main St
- 119 E Davis Ave
- 121 E Davis Ave
- 1220 S Cedar St
- 813 E Teresa Ave
- 1109 S Division St
- 8 W Fairlane Place
- 10 E Fairlane Place
- 22 E Fairlane Place
- 1 E Fairlane Dr
- 13 E Fairlane Place
- 12 W Fairlane Place
- 9 E Fairlane Place
- 5 W Fairlane Dr
- 3 E Fairlane Dr
- 17 E Fairlane Place
- 28 E Fairlane Place
- 9 W Fairlane Dr
- 21 E Fairlane Place
- 1 E Fairlane Place
- 14 W Fairlane Place
- 7 E Fairlane Dr
- 34 E Fairlane Place
- 25 E Fairlane Place
- 13 W Fairlane Dr
- 18 E Fairlane Ct