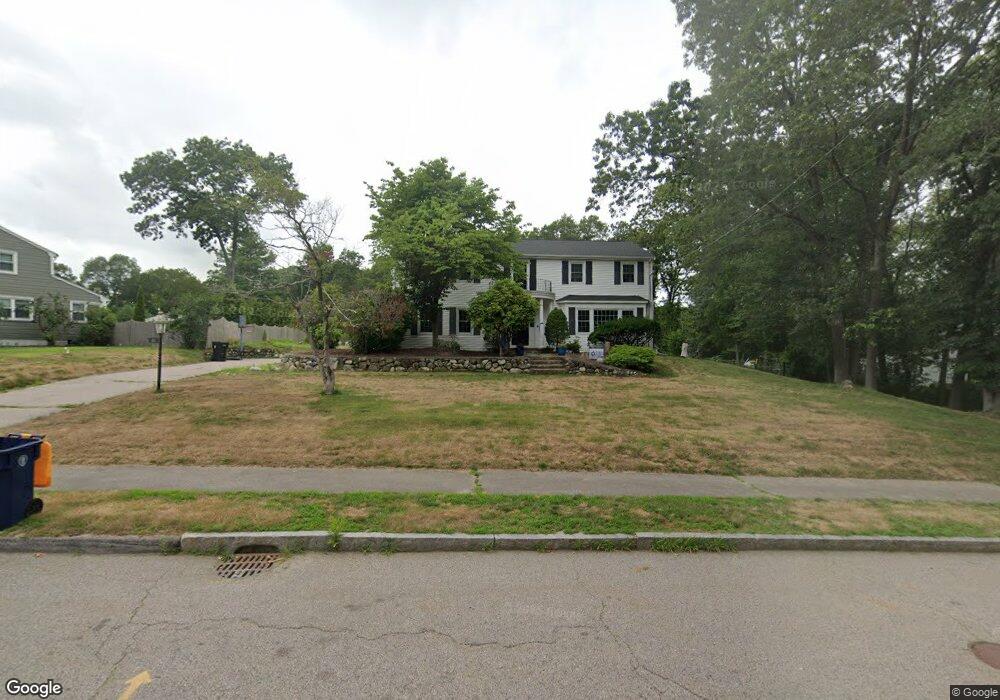
6 W Ridge Dr Sharon, MA 02067
Estimated Value: $947,000 - $1,183,000
4
Beds
3
Baths
2,362
Sq Ft
$440/Sq Ft
Est. Value
About This Home
This home is located at 6 W Ridge Dr, Sharon, MA 02067 and is currently estimated at $1,039,343, approximately $440 per square foot. 6 W Ridge Dr is a home located in Norfolk County with nearby schools including East Elementary School, Sharon Middle School, and Sharon High School.
Ownership History
Date
Name
Owned For
Owner Type
Purchase Details
Closed on
May 25, 2021
Sold by
Brooker George M
Bought by
Freyman David and Freyman Larisa
Current Estimated Value
Home Financials for this Owner
Home Financials are based on the most recent Mortgage that was taken out on this home.
Original Mortgage
$610,400
Outstanding Balance
$552,310
Interest Rate
3%
Mortgage Type
Purchase Money Mortgage
Estimated Equity
$487,033
Create a Home Valuation Report for This Property
The Home Valuation Report is an in-depth analysis detailing your home's value as well as a comparison with similar homes in the area
Home Values in the Area
Average Home Value in this Area
Purchase History
| Date | Buyer | Sale Price | Title Company |
|---|---|---|---|
| Freyman David | $763,000 | None Available |
Source: Public Records
Mortgage History
| Date | Status | Borrower | Loan Amount |
|---|---|---|---|
| Open | Freyman David | $610,400 |
Source: Public Records
Tax History
| Year | Tax Paid | Tax Assessment Tax Assessment Total Assessment is a certain percentage of the fair market value that is determined by local assessors to be the total taxable value of land and additions on the property. | Land | Improvement |
|---|---|---|---|---|
| 2025 | $15,428 | $882,600 | $485,300 | $397,300 |
| 2024 | $14,757 | $839,400 | $445,300 | $394,100 |
| 2023 | $14,153 | $761,300 | $416,300 | $345,000 |
| 2022 | $13,365 | $676,700 | $346,800 | $329,900 |
| 2021 | $13,239 | $648,000 | $327,100 | $320,900 |
| 2020 | $12,312 | $648,000 | $327,100 | $320,900 |
| 2019 | $12,512 | $644,600 | $304,400 | $340,200 |
| 2018 | $12,312 | $635,600 | $298,600 | $337,000 |
| 2017 | $12,092 | $616,300 | $279,300 | $337,000 |
| 2016 | $11,813 | $587,400 | $279,300 | $308,100 |
| 2015 | $11,344 | $558,800 | $260,300 | $298,500 |
| 2014 | $10,526 | $512,200 | $236,700 | $275,500 |
Source: Public Records
Map
Nearby Homes
- 157 Wilshire Dr
- 4 Robinette Rd
- 9 Williams Rd
- 114 Powell St
- 49 Powell St
- 74 Eisenhower Dr
- 12 Eastwood Rd
- 2 Palace Ct
- Lot 4 West St
- 17 Donald Rd
- 15 Paul Revere Rd
- 2040 Central St
- 2 Sherwood Cir
- 115 Kennedy Rd
- 25 Bayberry Dr Unit 1
- 438 School St
- 58 Ames St
- 3 Trowel Shop Pond Rd Unit 3
- 20 Trowel Shop Pond Rd Unit 24
- 16 Trowel Shop Pond Rd Unit 16
Your Personal Tour Guide
Ask me questions while you tour the home.