Estimated Value: $289,786 - $367,000
--
Bed
1
Bath
1,935
Sq Ft
$168/Sq Ft
Est. Value
About This Home
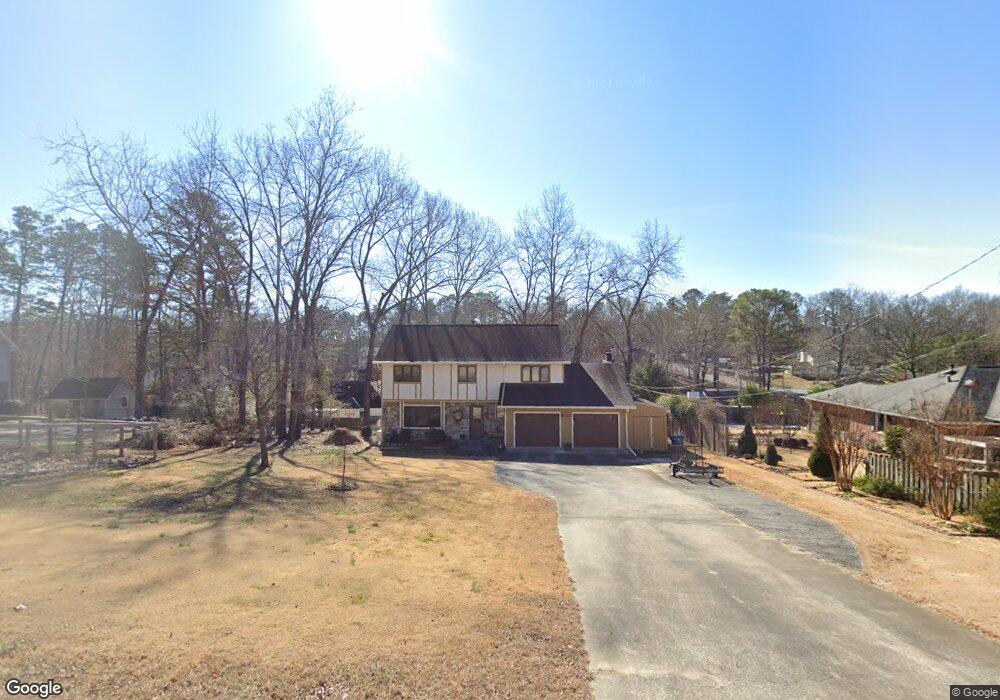
This home is located at 6 Warwick Way SE, Rome, GA 30161 and is currently estimated at $325,447, approximately $168 per square foot. 6 Warwick Way SE is a home located in Floyd County with nearby schools including Pepperell Middle School, Pepperell High School, and Montessori School of Rome.
Ownership History
Date
Name
Owned For
Owner Type
Purchase Details
Closed on
Jul 20, 2006
Sold by
Not Provided
Bought by
Kapitza Paul J and Kapitza Susan J
Current Estimated Value
Home Financials for this Owner
Home Financials are based on the most recent Mortgage that was taken out on this home.
Original Mortgage
$137,500
Outstanding Balance
$81,856
Interest Rate
6.7%
Mortgage Type
New Conventional
Estimated Equity
$243,591
Purchase Details
Closed on
Jul 15, 2002
Sold by
Pierce William D and Pierce Rebecca A
Bought by
Pierce Rebecca A
Purchase Details
Closed on
Nov 30, 2001
Sold by
Fountain Anita M
Bought by
Pierce William D and Pierce Rebecca A
Purchase Details
Closed on
Jul 30, 1982
Sold by
Fountian Howard W and Fountian Anita M
Bought by
Fountain Anita M
Purchase Details
Closed on
Sep 29, 1977
Sold by
Johnny Mcdonald Builders Inc
Bought by
Fountian Howard W and Fountian Anita M
Purchase Details
Closed on
Jun 15, 1977
Sold by
N R S Properties Inc
Bought by
Johnny Mcdonald Builders Inc
Purchase Details
Closed on
Jun 12, 1975
Bought by
N R S Properties Inc
Create a Home Valuation Report for This Property
The Home Valuation Report is an in-depth analysis detailing your home's value as well as a comparison with similar homes in the area
Home Values in the Area
Average Home Value in this Area
Purchase History
| Date | Buyer | Sale Price | Title Company |
|---|---|---|---|
| Kapitza Paul J | $148,000 | -- | |
| Pierce Rebecca A | -- | -- | |
| Pierce William D | $130,000 | -- | |
| Fountain Anita M | $51,500 | -- | |
| Fountian Howard W | -- | -- | |
| Johnny Mcdonald Builders Inc | $55,000 | -- | |
| N R S Properties Inc | -- | -- |
Source: Public Records
Mortgage History
| Date | Status | Borrower | Loan Amount |
|---|---|---|---|
| Open | Kapitza Paul J | $137,500 |
Source: Public Records
Tax History Compared to Growth
Tax History
| Year | Tax Paid | Tax Assessment Tax Assessment Total Assessment is a certain percentage of the fair market value that is determined by local assessors to be the total taxable value of land and additions on the property. | Land | Improvement |
|---|---|---|---|---|
| 2024 | $1,648 | $98,477 | $8,217 | $90,260 |
| 2023 | $1,593 | $91,099 | $7,250 | $83,849 |
| 2022 | $1,395 | $76,904 | $5,800 | $71,104 |
| 2021 | $1,306 | $70,816 | $5,800 | $65,016 |
| 2020 | $1,173 | $63,040 | $4,592 | $58,448 |
| 2019 | $976 | $56,659 | $4,592 | $52,067 |
| 2018 | $900 | $54,200 | $4,592 | $49,608 |
| 2017 | $864 | $52,971 | $4,592 | $48,379 |
| 2016 | $1,560 | $52,280 | $4,560 | $47,720 |
| 2015 | $1,584 | $54,092 | $4,560 | $49,532 |
| 2014 | $1,584 | $54,092 | $4,560 | $49,532 |
Source: Public Records
Map
Nearby Homes
- 85 Cambridge Dr SE
- 111 Warwick Way SE
- 0 Warwick Way SE Unit 10624495
- 0 Warwick Way SE Unit 7666193
- 113 Warwick Way SE
- 11 Cambridge Dr SE
- 0 Wellington Way SE Unit 7374602
- 0 Wellington Way SE Unit 20180068
- 0 Wellington Way SE Unit 7374604
- 0 Wellington Way SE Unit 20180069
- 18 Devonshire Dr SE
- 0 Camelot Cir SE Unit 7662985
- 0 Camelot Cir SE Unit 10621392
- 52 Twickenham Rd SE
- 7 Rushden Way SE
- 3 Rushden Way SE
- 9 Wellington Way SE
- 28 Rushden Way SE
- 14 Wellington Way SE
- 30 Rushden Way SE
- 4 Warwick Way SE
- 9 London Ln SE
- 9 London Ln SE
- 9 London Ln SE Unit 22-23
- 9 Warwick Way SE
- 2 Warwick Way SE
- 10 Warwick Way SE Unit 37
- 10 Warwick Way SE
- 46 Warwick Way SE
- 11 London Ln SE
- 5 Warwick Way SE
- 44 Warwick Way SE
- 0 London Ln SE Unit 7296724
- 12 Warwick Way SE
- 13 Warwick Way SE
- 3 Warwick Way SE
- 13 Downing St SE
- 13 London Ln SE
- 11 Downing St SE
- 15 Downing St SE