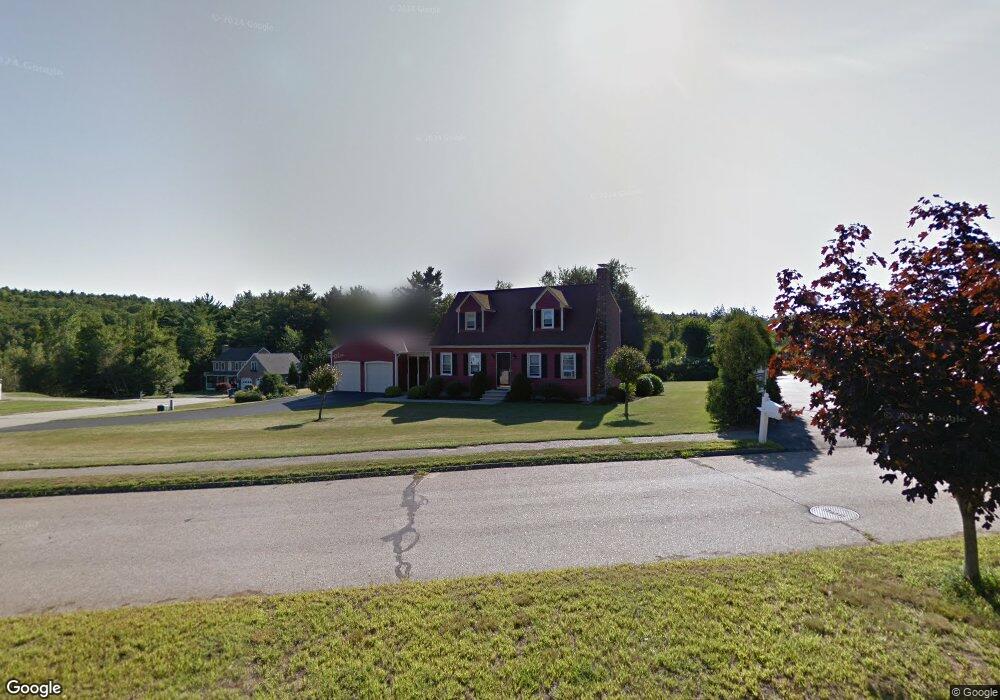
6 Watson Ln Rutland, MA 01543
Estimated Value: $513,700 - $638,000
3
Beds
2
Baths
1,600
Sq Ft
$356/Sq Ft
Est. Value
About This Home
This home is located at 6 Watson Ln, Rutland, MA 01543 and is currently estimated at $569,675, approximately $356 per square foot. 6 Watson Ln is a home located in Worcester County with nearby schools including Wachusett Regional High School.
Ownership History
Date
Name
Owned For
Owner Type
Purchase Details
Closed on
Aug 26, 1996
Sold by
Browning Robert and Browning Patricia
Bought by
Ferro Michael and Ferro Margaret
Current Estimated Value
Purchase Details
Closed on
Feb 6, 1992
Sold by
Gengel C & S Bldrs Inc
Bought by
Browning Robert and Browning Patricia
Create a Home Valuation Report for This Property
The Home Valuation Report is an in-depth analysis detailing your home's value as well as a comparison with similar homes in the area
Home Values in the Area
Average Home Value in this Area
Purchase History
| Date | Buyer | Sale Price | Title Company |
|---|---|---|---|
| Ferro Michael | $150,000 | -- | |
| Browning Robert | $129,900 | -- |
Source: Public Records
Mortgage History
| Date | Status | Borrower | Loan Amount |
|---|---|---|---|
| Open | Browning Robert | $125,000 | |
| Closed | Browning Robert | $60,000 | |
| Closed | Browning Robert | $25,000 |
Source: Public Records
Tax History
| Year | Tax Paid | Tax Assessment Tax Assessment Total Assessment is a certain percentage of the fair market value that is determined by local assessors to be the total taxable value of land and additions on the property. | Land | Improvement |
|---|---|---|---|---|
| 2025 | $6,955 | $488,400 | $113,400 | $375,000 |
| 2024 | $6,211 | $418,800 | $106,100 | $312,700 |
| 2023 | $5,662 | $412,700 | $100,000 | $312,700 |
| 2022 | $5,623 | $356,100 | $83,100 | $273,000 |
| 2021 | $5,539 | $331,700 | $90,100 | $241,600 |
| 2020 | $5,903 | $335,200 | $80,700 | $254,500 |
| 2019 | $5,843 | $326,600 | $69,700 | $256,900 |
| 2018 | $5,740 | $316,600 | $69,700 | $246,900 |
| 2017 | $5,287 | $288,600 | $69,700 | $218,900 |
| 2016 | $4,910 | $282,700 | $73,500 | $209,200 |
| 2015 | $4,557 | $258,200 | $73,500 | $184,700 |
| 2014 | $4,418 | $258,200 | $73,500 | $184,700 |
Source: Public Records
Map
Nearby Homes
- 39 Laurelwood Rd
- 22 Village Way
- 5 Miles Rd
- 11 Lewis St
- 21 Lewis St
- 27 Lewis St
- 12 Lewis St
- 28 Forest Hill Dr
- 6 Lewis St
- 8 Vista Cir
- 85 Maple Ave Unit A
- 132 Fidelity Dr Unit 61
- 210 Fidelity Dr Unit 84
- 212 Fidelity Dr Unit 83
- 10 Fidelity Dr Unit 5
- 12 Fidelity Dr Unit 6
- 5 Karen Way
- 18 Fidelity Dr Unit 9
- 20 Fidelity Dr Unit 10
- 15 Fidelity Dr Unit 70
Your Personal Tour Guide
Ask me questions while you tour the home.