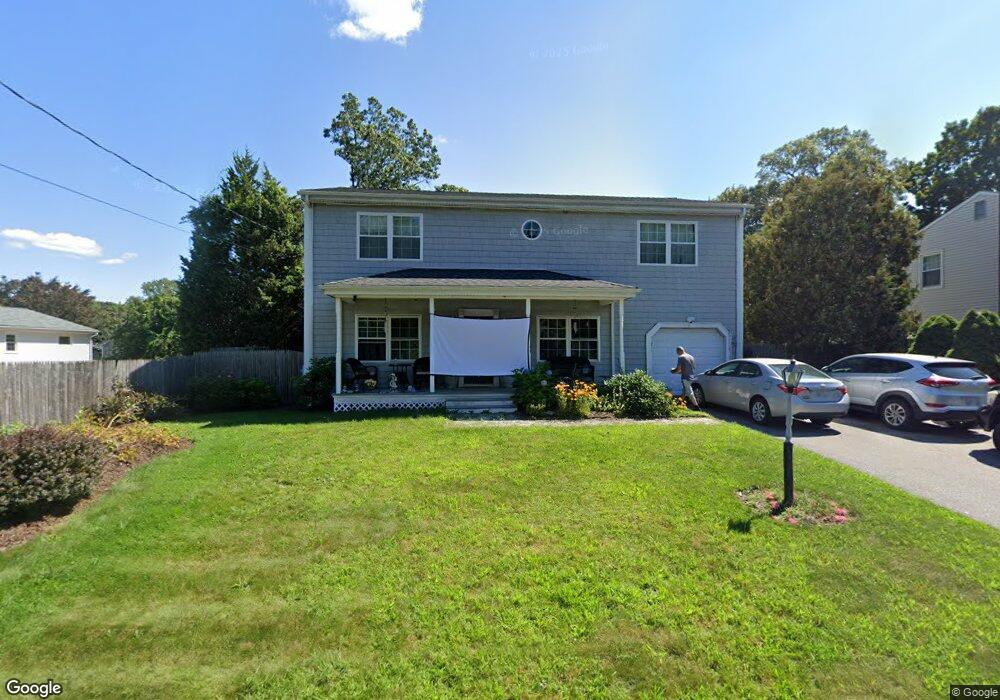
6 Waverly Rd Riverside, RI 02915
Riverside NeighborhoodEstimated Value: $529,000 - $652,000
3
Beds
2
Baths
2,248
Sq Ft
$260/Sq Ft
Est. Value
About This Home
This home is located at 6 Waverly Rd, Riverside, RI 02915 and is currently estimated at $583,787, approximately $259 per square foot. 6 Waverly Rd is a home located in Providence County with nearby schools including East Providence High School, St Luke Elementary School, and Barrington Christian Academy.
Ownership History
Date
Name
Owned For
Owner Type
Purchase Details
Closed on
Feb 25, 2013
Sold by
Tierney Jereld P and Rattie Jalynn M
Bought by
Tierney Jereld P and Rierney Jaclynn M
Current Estimated Value
Purchase Details
Closed on
Mar 30, 1992
Sold by
Motta Manuel E
Bought by
Tierney Jereld P
Home Financials for this Owner
Home Financials are based on the most recent Mortgage that was taken out on this home.
Original Mortgage
$127,300
Interest Rate
8.66%
Mortgage Type
Purchase Money Mortgage
Create a Home Valuation Report for This Property
The Home Valuation Report is an in-depth analysis detailing your home's value as well as a comparison with similar homes in the area
Home Values in the Area
Average Home Value in this Area
Purchase History
| Date | Buyer | Sale Price | Title Company |
|---|---|---|---|
| Tierney Jereld P | -- | -- | |
| Tierney Jereld P | $134,000 | -- | |
| Tierney Jereld P | -- | -- | |
| Tierney Jereld P | $134,000 | -- |
Source: Public Records
Mortgage History
| Date | Status | Borrower | Loan Amount |
|---|---|---|---|
| Previous Owner | Tierney Jereld P | $210,000 | |
| Previous Owner | Tierney Jereld P | $116,000 | |
| Previous Owner | Tierney Jereld P | $127,300 |
Source: Public Records
Tax History
| Year | Tax Paid | Tax Assessment Tax Assessment Total Assessment is a certain percentage of the fair market value that is determined by local assessors to be the total taxable value of land and additions on the property. | Land | Improvement |
|---|---|---|---|---|
| 2025 | $7,813 | $597,800 | $137,300 | $460,500 |
| 2024 | $7,829 | $510,700 | $114,400 | $396,300 |
| 2023 | $7,538 | $510,700 | $114,400 | $396,300 |
| 2022 | $8,633 | $394,900 | $61,300 | $333,600 |
| 2021 | $8,490 | $394,900 | $55,700 | $339,200 |
| 2020 | $8,131 | $394,900 | $55,700 | $339,200 |
| 2019 | $7,906 | $394,900 | $55,700 | $339,200 |
| 2018 | $8,353 | $365,100 | $68,000 | $297,100 |
| 2017 | $8,167 | $365,100 | $68,000 | $297,100 |
| 2016 | $8,127 | $365,100 | $68,000 | $297,100 |
| 2015 | $8,785 | $382,800 | $57,400 | $325,400 |
| 2014 | $8,785 | $382,800 | $57,400 | $325,400 |
Source: Public Records
Map
Nearby Homes