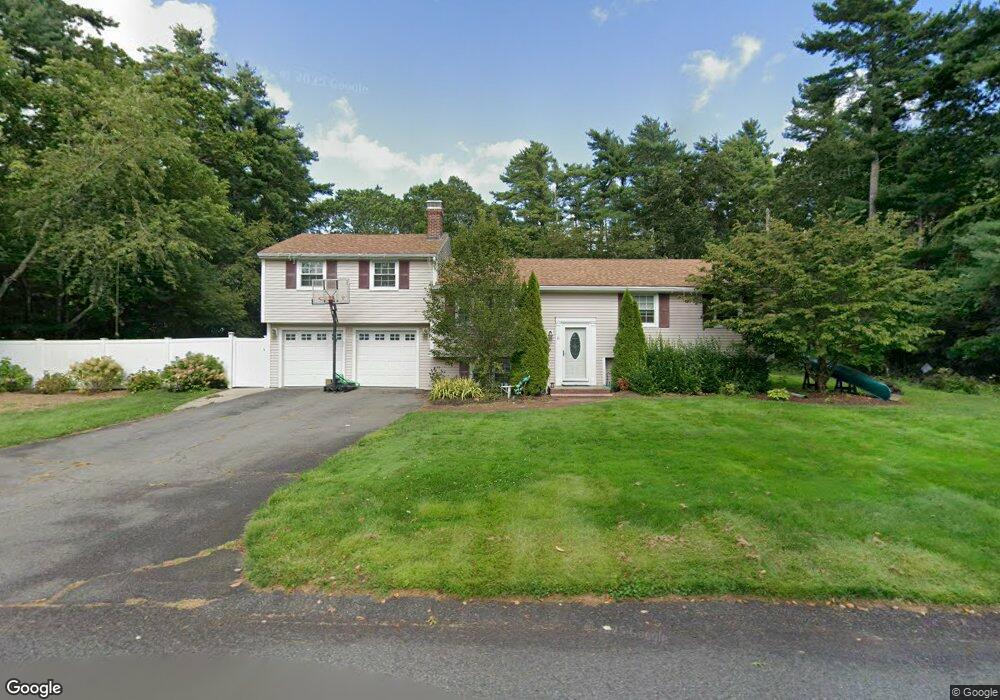
6 Wenham Shores Dr Carver, MA 02330
Estimated Value: $462,000 - $667,000
3
Beds
2
Baths
2,144
Sq Ft
$274/Sq Ft
Est. Value
About This Home
This home is located at 6 Wenham Shores Dr, Carver, MA 02330 and is currently estimated at $587,917, approximately $274 per square foot. 6 Wenham Shores Dr is a home located in Plymouth County with nearby schools including Carver Elementary School and Map Academy Charter School.
Ownership History
Date
Name
Owned For
Owner Type
Purchase Details
Closed on
Jan 28, 2020
Sold by
Hayes Ft
Bought by
Barbosa Claydson A
Current Estimated Value
Purchase Details
Closed on
Jul 11, 2003
Sold by
Mcdaniel James D and Mcdaniel Yong H
Bought by
Hayes Kyle
Home Financials for this Owner
Home Financials are based on the most recent Mortgage that was taken out on this home.
Original Mortgage
$265,500
Interest Rate
5.45%
Mortgage Type
Purchase Money Mortgage
Create a Home Valuation Report for This Property
The Home Valuation Report is an in-depth analysis detailing your home's value as well as a comparison with similar homes in the area
Home Values in the Area
Average Home Value in this Area
Purchase History
| Date | Buyer | Sale Price | Title Company |
|---|---|---|---|
| Barbosa Claydson A | $240,000 | None Available | |
| Hayes Kyle | $295,000 | -- |
Source: Public Records
Mortgage History
| Date | Status | Borrower | Loan Amount |
|---|---|---|---|
| Previous Owner | Hayes Kyle | $269,000 | |
| Previous Owner | Hayes Kyle | $265,500 |
Source: Public Records
Tax History Compared to Growth
Tax History
| Year | Tax Paid | Tax Assessment Tax Assessment Total Assessment is a certain percentage of the fair market value that is determined by local assessors to be the total taxable value of land and additions on the property. | Land | Improvement |
|---|---|---|---|---|
| 2025 | $7,038 | $507,400 | $152,700 | $354,700 |
| 2024 | $6,949 | $490,400 | $149,700 | $340,700 |
| 2023 | $6,687 | $458,300 | $149,700 | $308,600 |
| 2022 | $6,389 | $399,800 | $133,600 | $266,200 |
| 2021 | $6,136 | $362,200 | $119,300 | $242,900 |
| 2020 | $5,838 | $339,600 | $111,500 | $228,100 |
| 2019 | $5,630 | $330,200 | $108,200 | $222,000 |
| 2018 | $5,399 | $301,400 | $99,200 | $202,200 |
| 2017 | $5,005 | $282,900 | $91,100 | $191,800 |
| 2016 | $4,440 | $260,700 | $86,800 | $173,900 |
| 2015 | $4,275 | $251,300 | $82,600 | $168,700 |
| 2014 | $4,147 | $243,800 | $104,500 | $139,300 |
Source: Public Records
Map
Nearby Homes
- 4 Wenham Shores Dr
- 8 Wenham Shores Dr
- 5 Wenham Shores Dr
- 9 Wenham Shores Dr
- 10 Wenham Shores Dr
- 2 Wenham Shores Dr
- 4 Edgewood Rd
- 1 Edgewood Rd
- 66 Plymouth St
- 11 Wenham Shores Dr
- 8 Edgewood Rd
- 3 Edgewood Rd
- 64 Plymouth St
- 1 Wenham Shores Dr
- 12 Wenham Shores Dr
- 5 Edgewood Rd
- 62 Plymouth St
- 68 Plymouth St
- 7 Edgewood Rd
- 10 Edgewood Rd