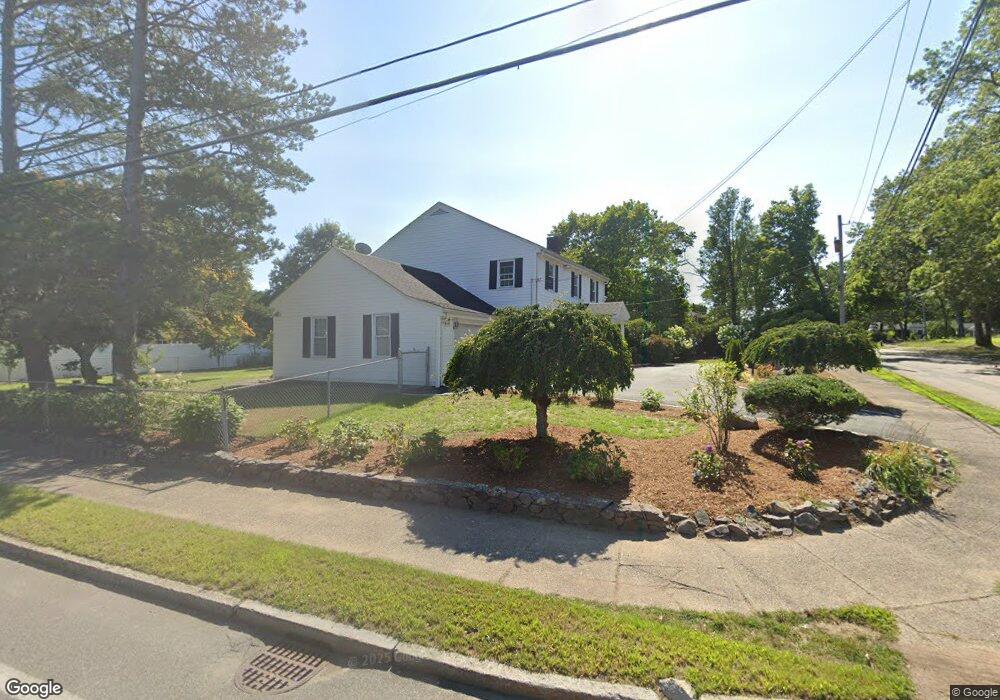
6 West Ave Brockton, MA 02301
Winters Corner NeighborhoodEstimated Value: $651,882 - $781,000
3
Beds
3
Baths
2,560
Sq Ft
$283/Sq Ft
Est. Value
About This Home
This home is located at 6 West Ave, Brockton, MA 02301 and is currently estimated at $724,721, approximately $283 per square foot. 6 West Ave is a home located in Plymouth County with nearby schools including Manthala George Jr. School, Hancock Elementary School, and Louis F Angelo Elementary School.
Ownership History
Date
Name
Owned For
Owner Type
Purchase Details
Closed on
Jun 5, 1998
Sold by
Ozbilen Birol
Bought by
Kong Yom Ros and Kong Chantha
Current Estimated Value
Purchase Details
Closed on
Nov 27, 1990
Sold by
Levine Paula R
Bought by
Ozbilen Birol
Create a Home Valuation Report for This Property
The Home Valuation Report is an in-depth analysis detailing your home's value as well as a comparison with similar homes in the area
Home Values in the Area
Average Home Value in this Area
Purchase History
| Date | Buyer | Sale Price | Title Company |
|---|---|---|---|
| Kong Yom Ros | $159,000 | -- | |
| Ozbilen Birol | $180,000 | -- |
Source: Public Records
Mortgage History
| Date | Status | Borrower | Loan Amount |
|---|---|---|---|
| Open | Ozbilen Birol | $23,500 | |
| Closed | Ozbilen Birol | $10,000 | |
| Open | Ozbilen Birol | $250,000 | |
| Closed | Ozbilen Birol | $205,000 |
Source: Public Records
Tax History Compared to Growth
Tax History
| Year | Tax Paid | Tax Assessment Tax Assessment Total Assessment is a certain percentage of the fair market value that is determined by local assessors to be the total taxable value of land and additions on the property. | Land | Improvement |
|---|---|---|---|---|
| 2025 | $6,538 | $539,900 | $153,900 | $386,000 |
| 2024 | $6,448 | $536,400 | $153,900 | $382,500 |
| 2023 | $6,686 | $515,100 | $119,500 | $395,600 |
| 2022 | $6,514 | $466,300 | $108,900 | $357,400 |
| 2021 | $5,904 | $407,200 | $100,600 | $306,600 |
| 2020 | $6,113 | $403,500 | $96,400 | $307,100 |
| 2019 | $5,624 | $361,900 | $90,100 | $271,800 |
| 2018 | $5,547 | $345,400 | $90,100 | $255,300 |
| 2017 | $5,265 | $327,000 | $90,100 | $236,900 |
| 2016 | $5,515 | $317,700 | $86,400 | $231,300 |
| 2015 | $5,293 | $291,600 | $86,400 | $205,200 |
| 2014 | $5,328 | $293,900 | $86,400 | $207,500 |
Source: Public Records
Map
Nearby Homes
- 28 Fern Ave
- 37 West St
- 25 Monson St
- 48 N Belcher Ave
- 72 W Elm Terrace
- 161 Moraine St
- 17 Moraine Place
- 67 Sycamore Ave Unit 3
- 45 Briarcliff Rd
- 20 Montauk Rd
- 21 Oneida Ave
- 15 Byron Ave
- 175 Belmont Ave
- 78 Keene St
- 117 Fairview Ave
- 77 Colonel Bell Dr Unit 4
- 61 Fairfield St
- 190 Highland St
- 281 Spring St
- 141 Prospect Ave