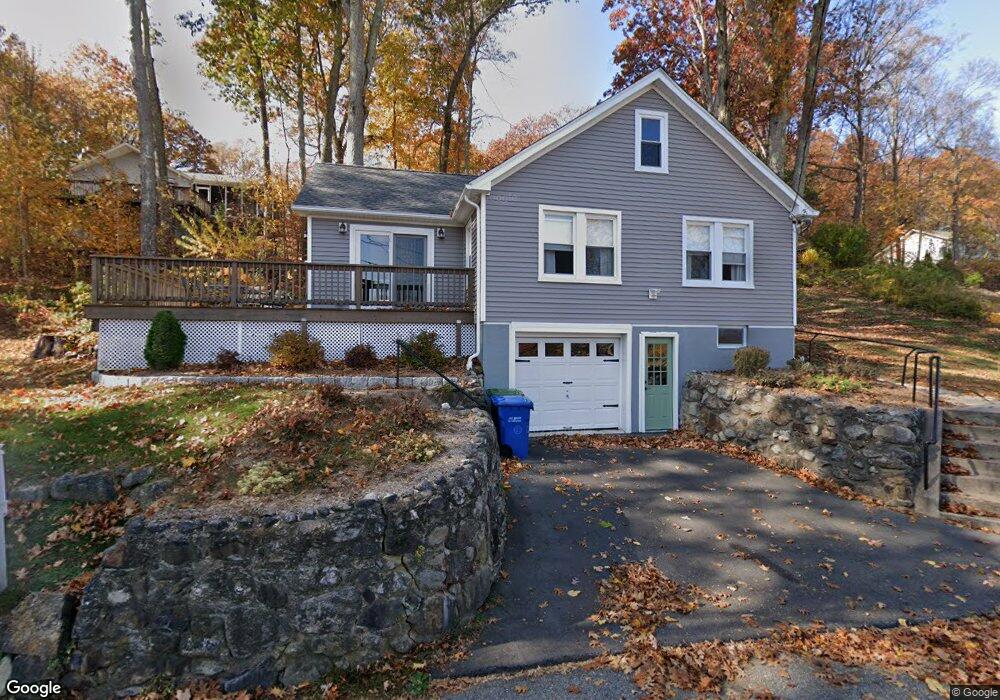
6 West Ln East Hampton, CT 06424
Estimated Value: $427,000 - $506,000
3
Beds
3
Baths
1,104
Sq Ft
$420/Sq Ft
Est. Value
About This Home
This home is located at 6 West Ln, East Hampton, CT 06424 and is currently estimated at $463,367, approximately $419 per square foot. 6 West Ln is a home located in Middlesex County with nearby schools including Memorial School, Center Elementary School, and East Hampton Middle School.
Ownership History
Date
Name
Owned For
Owner Type
Purchase Details
Closed on
Sep 10, 2021
Sold by
Bartlett Lawrence S
Bought by
Haubert Gary and Haubert Anne
Current Estimated Value
Home Financials for this Owner
Home Financials are based on the most recent Mortgage that was taken out on this home.
Original Mortgage
$215,000
Outstanding Balance
$195,342
Interest Rate
2.7%
Mortgage Type
Purchase Money Mortgage
Estimated Equity
$268,025
Purchase Details
Closed on
Aug 21, 2018
Sold by
East Hampton Town Of
Bought by
Fructus Holdings Llc
Create a Home Valuation Report for This Property
The Home Valuation Report is an in-depth analysis detailing your home's value as well as a comparison with similar homes in the area
Home Values in the Area
Average Home Value in this Area
Purchase History
| Date | Buyer | Sale Price | Title Company |
|---|---|---|---|
| Haubert Gary | $345,000 | None Available | |
| Haubert Gary | $345,000 | None Available | |
| Haubert Gary | $345,000 | None Available | |
| Fructus Holdings Llc | $61,000 | -- | |
| Fructus Holdings Llc | $61,000 | -- | |
| Fructus Holdings Llc | $61,000 | -- |
Source: Public Records
Mortgage History
| Date | Status | Borrower | Loan Amount |
|---|---|---|---|
| Open | Haubert Gary | $215,000 | |
| Closed | Haubert Gary | $215,000 |
Source: Public Records
Tax History Compared to Growth
Tax History
| Year | Tax Paid | Tax Assessment Tax Assessment Total Assessment is a certain percentage of the fair market value that is determined by local assessors to be the total taxable value of land and additions on the property. | Land | Improvement |
|---|---|---|---|---|
| 2025 | $8,233 | $207,340 | $66,400 | $140,940 |
| 2024 | $7,887 | $207,340 | $66,400 | $140,940 |
| 2023 | $7,477 | $207,340 | $66,400 | $140,940 |
| 2022 | $7,186 | $207,340 | $66,400 | $140,940 |
| 2021 | $3,970 | $114,960 | $66,400 | $48,560 |
| 2020 | $3,071 | $92,660 | $45,750 | $46,910 |
| 2019 | $3,108 | $93,770 | $51,660 | $42,110 |
| 2018 | $2,937 | $93,770 | $51,660 | $42,110 |
| 2017 | $2,937 | $93,770 | $51,660 | $42,110 |
| 2016 | $2,761 | $93,770 | $51,660 | $42,110 |
| 2015 | $3,004 | $108,120 | $60,760 | $47,360 |
| 2014 | $2,613 | $108,120 | $60,760 | $47,360 |
Source: Public Records
Map
Nearby Homes