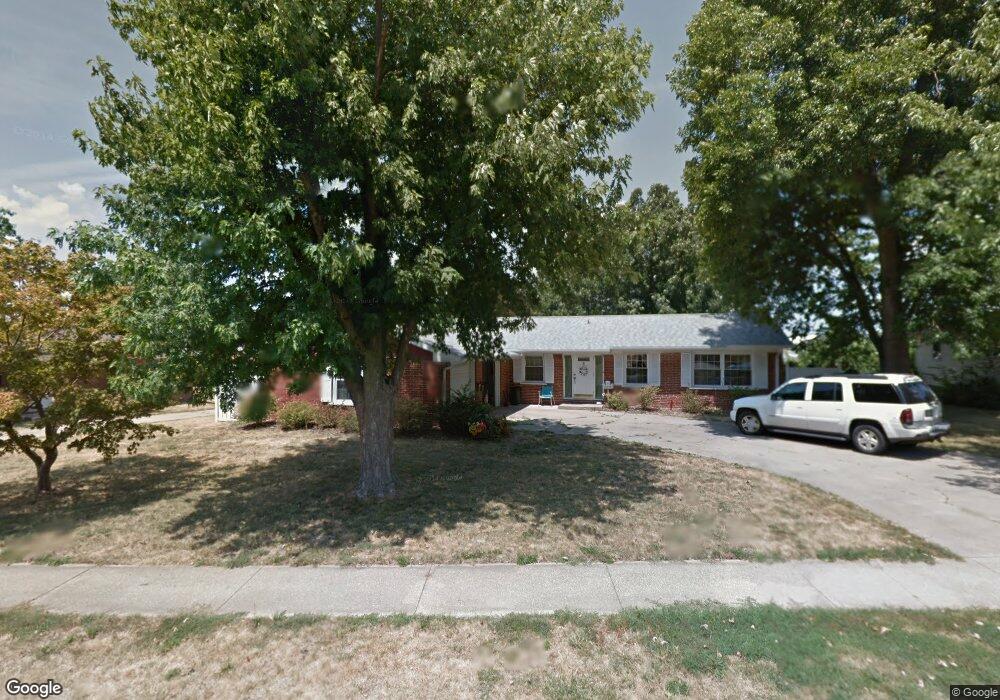
6 Westfair Dr Jacksonville, IL 62650
Estimated Value: $177,000 - $212,000
4
Beds
2
Baths
1,680
Sq Ft
$115/Sq Ft
Est. Value
About This Home
This home is located at 6 Westfair Dr, Jacksonville, IL 62650 and is currently estimated at $193,310, approximately $115 per square foot. 6 Westfair Dr is a home located in Morgan County with nearby schools including Jacksonville High School, Westfair Christian Academy, and Salem Lutheran School.
Ownership History
Date
Name
Owned For
Owner Type
Purchase Details
Closed on
Mar 6, 2024
Sold by
Hubert Cheri Lynn
Bought by
Cheri Lynn Hubert Revocable Trust and Hubert
Current Estimated Value
Purchase Details
Closed on
Jul 18, 2018
Sold by
Harbison Charles G and Harbison Marilyn J
Bought by
Hubert Cheri Lynn
Purchase Details
Closed on
Jan 10, 2017
Sold by
Harbison Charles G and Harbison Marilyn J
Bought by
Harbison Charles G and Harbison Marilyn J
Purchase Details
Closed on
Jun 11, 2009
Sold by
Dahman Andrew M and Dahman Melinda R
Bought by
Harbison Charles and Harbison Marilyn
Purchase Details
Closed on
Jul 15, 2005
Sold by
Carroll Peggy J
Bought by
Dahama Andrew M and Dahman Melinda R
Home Financials for this Owner
Home Financials are based on the most recent Mortgage that was taken out on this home.
Original Mortgage
$77,125
Interest Rate
6.25%
Mortgage Type
Purchase Money Mortgage
Create a Home Valuation Report for This Property
The Home Valuation Report is an in-depth analysis detailing your home's value as well as a comparison with similar homes in the area
Home Values in the Area
Average Home Value in this Area
Purchase History
| Date | Buyer | Sale Price | Title Company |
|---|---|---|---|
| Cheri Lynn Hubert Revocable Trust | -- | None Listed On Document | |
| Hubert Cheri Lynn | $126,000 | Attorney | |
| Harbison Charles G | -- | None Available | |
| Harbison Charles | $105,000 | None Available | |
| Dahama Andrew M | $103,000 | None Available |
Source: Public Records
Mortgage History
| Date | Status | Borrower | Loan Amount |
|---|---|---|---|
| Previous Owner | Dahama Andrew M | $77,125 |
Source: Public Records
Tax History Compared to Growth
Tax History
| Year | Tax Paid | Tax Assessment Tax Assessment Total Assessment is a certain percentage of the fair market value that is determined by local assessors to be the total taxable value of land and additions on the property. | Land | Improvement |
|---|---|---|---|---|
| 2024 | $4,828 | $55,490 | $6,360 | $49,130 |
| 2023 | $4,818 | $51,110 | $6,360 | $44,750 |
| 2022 | $4,422 | $46,410 | $6,360 | $40,050 |
| 2021 | $3,911 | $41,930 | $6,360 | $35,570 |
| 2020 | $3,834 | $40,290 | $6,360 | $33,930 |
| 2019 | $3,699 | $39,150 | $6,680 | $32,470 |
| 2018 | $3,567 | $39,150 | $6,680 | $32,470 |
| 2017 | $3,489 | $39,150 | $6,680 | $32,470 |
| 2016 | $3,386 | $37,610 | $7,550 | $30,060 |
| 2015 | $3,345 | $36,510 | $7,330 | $29,180 |
| 2014 | $3,345 | $36,510 | $7,330 | $29,180 |
| 2013 | $3,155 | $36,510 | $7,330 | $29,180 |
Source: Public Records
Map
Nearby Homes
- 8 Westfair Dr
- 3 Ivywood Dr
- 207 Mound Place
- 1815 Mound Rd
- 121 City Place
- 17 Merrygrove Dr
- 2 Valleyview Rd
- 1325 W College Ave
- 1856 Plum St
- 1503 Mound Ave
- 1835 Mound Rd
- 414 S Westgate Ave
- 290 Finley St
- 310 Woodland Place
- 231 N Webster Ave
- 33 Windrush Dr
- 8 Duncan Park
- 1924 Cedar St
- 13 Morningside Dr
- 1305 W Lafayette Ave