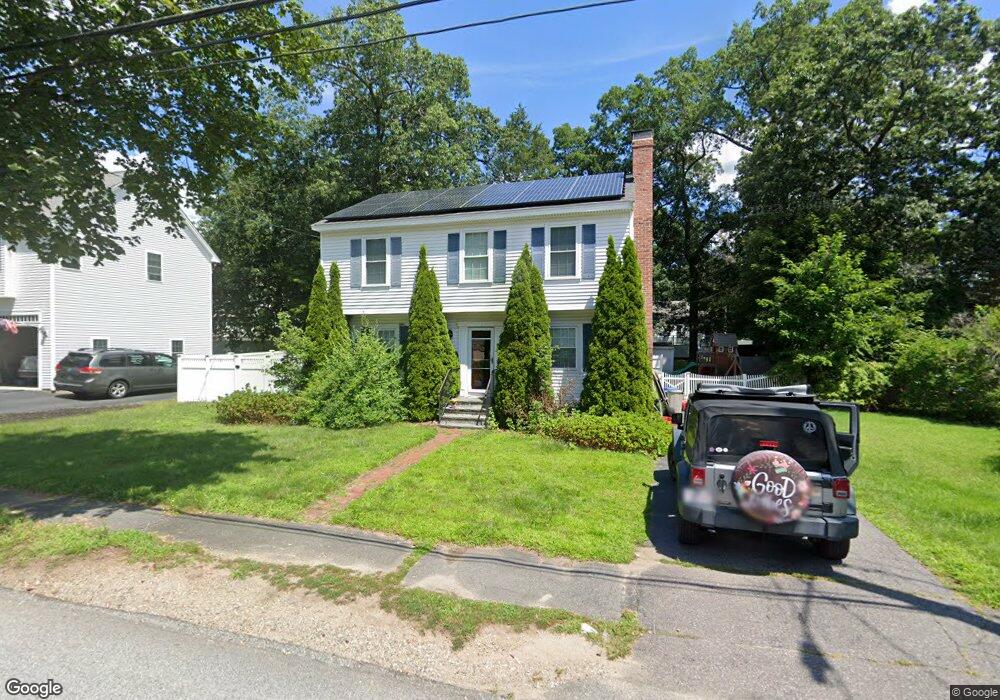
6 Whittier Rd Reading, MA 01867
Estimated Value: $846,000 - $1,038,000
3
Beds
1
Bath
1,556
Sq Ft
$623/Sq Ft
Est. Value
About This Home
This home is located at 6 Whittier Rd, Reading, MA 01867 and is currently estimated at $969,549, approximately $623 per square foot. 6 Whittier Rd is a home located in Middlesex County with nearby schools including Birch Meadow Elementary School, Arthur W. Coolidge Middle School, and Reading Memorial High School.
Ownership History
Date
Name
Owned For
Owner Type
Purchase Details
Closed on
Jun 14, 2024
Sold by
Hurley Ft and Hurley
Bought by
Hurley Jonathan D
Current Estimated Value
Purchase Details
Closed on
Jan 15, 2015
Sold by
Hurley Jonathan and Hurley Pamela H
Bought by
Hurley Ft and Hurley
Purchase Details
Closed on
Nov 28, 2007
Sold by
Phelan Joseph
Bought by
Hurley Jonathan and Hurley Pamela H
Purchase Details
Closed on
Aug 22, 2005
Sold by
Mccullough Anne and Mccullough Seth A
Bought by
Phelan Joseph
Purchase Details
Closed on
Oct 15, 1999
Sold by
Gromyko Jon and Gromyko Dawnell M
Bought by
Mccullough Seth and Mccullough Anne M
Create a Home Valuation Report for This Property
The Home Valuation Report is an in-depth analysis detailing your home's value as well as a comparison with similar homes in the area
Home Values in the Area
Average Home Value in this Area
Purchase History
| Date | Buyer | Sale Price | Title Company |
|---|---|---|---|
| Hurley Jonathan D | -- | None Available | |
| Hurley Jonathan | -- | None Available | |
| Hurley Ft | -- | -- | |
| Hurley Jonathan | $392,500 | -- | |
| Phelan Joseph | $417,000 | -- | |
| Hurley Ft | -- | -- | |
| Hurley Jonathan D | $392,500 | -- | |
| Phelan Joseph J | $417,000 | -- | |
| Mccullough Seth | $222,800 | -- |
Source: Public Records
Mortgage History
| Date | Status | Borrower | Loan Amount |
|---|---|---|---|
| Previous Owner | Mccullough Seth | $300,000 | |
| Previous Owner | Mccullough Seth | $238,000 |
Source: Public Records
Tax History
| Year | Tax Paid | Tax Assessment Tax Assessment Total Assessment is a certain percentage of the fair market value that is determined by local assessors to be the total taxable value of land and additions on the property. | Land | Improvement |
|---|---|---|---|---|
| 2025 | $10,155 | $891,600 | $473,100 | $418,500 |
| 2024 | $10,043 | $856,900 | $454,500 | $402,400 |
| 2023 | $9,738 | $773,500 | $409,800 | $363,700 |
| 2022 | $9,384 | $704,000 | $372,500 | $331,500 |
| 2021 | $16,160 | $662,100 | $357,000 | $305,100 |
| 2020 | $8,794 | $630,400 | $339,700 | $290,700 |
| 2019 | $8,551 | $600,900 | $323,600 | $277,300 |
| 2018 | $7,866 | $567,100 | $305,100 | $262,000 |
| 2017 | $7,514 | $535,600 | $287,900 | $247,700 |
| 2016 | $5,955 | $410,700 | $257,900 | $152,800 |
| 2015 | $5,474 | $372,400 | $238,400 | $134,000 |
| 2014 | $5,302 | $359,700 | $230,300 | $129,400 |
Source: Public Records
Map
Nearby Homes
Your Personal Tour Guide
Ask me questions while you tour the home.