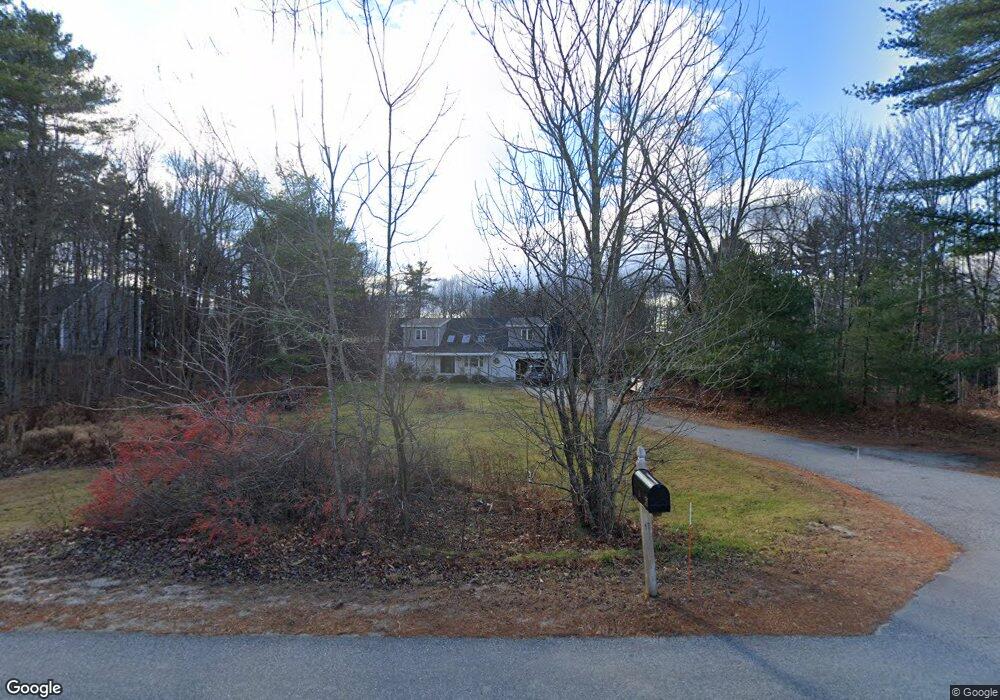
6 William Knight Rd Windham, ME 04062
Estimated Value: $581,016 - $796,000
3
Beds
3
Baths
2,439
Sq Ft
$265/Sq Ft
Est. Value
About This Home
This home is located at 6 William Knight Rd, Windham, ME 04062 and is currently estimated at $646,754, approximately $265 per square foot. 6 William Knight Rd is a home located in Cumberland County with nearby schools including Windham Primary School, Manchester School, and Windham Middle School.
Ownership History
Date
Name
Owned For
Owner Type
Purchase Details
Closed on
May 23, 2019
Sold by
Engel Stephen P and Engel Jeanne M
Bought by
Brickel Amy L and Brickel David
Current Estimated Value
Home Financials for this Owner
Home Financials are based on the most recent Mortgage that was taken out on this home.
Original Mortgage
$311,200
Outstanding Balance
$273,052
Interest Rate
4.1%
Mortgage Type
New Conventional
Estimated Equity
$373,702
Purchase Details
Closed on
Jul 19, 2018
Sold by
Engel Stephen P and Engel Jeanne M
Bought by
Engel Jeanne M and Engel Matthew J
Purchase Details
Closed on
Jul 7, 2016
Sold by
Cushman Jay
Bought by
Engel Stephen P and Engel Jeanne M
Home Financials for this Owner
Home Financials are based on the most recent Mortgage that was taken out on this home.
Original Mortgage
$257,933
Interest Rate
3.64%
Mortgage Type
FHA
Create a Home Valuation Report for This Property
The Home Valuation Report is an in-depth analysis detailing your home's value as well as a comparison with similar homes in the area
Home Values in the Area
Average Home Value in this Area
Purchase History
| Date | Buyer | Sale Price | Title Company |
|---|---|---|---|
| Brickel Amy L | -- | -- | |
| Engel Jeanne M | -- | -- | |
| Engel Stephen P | -- | -- |
Source: Public Records
Mortgage History
| Date | Status | Borrower | Loan Amount |
|---|---|---|---|
| Open | Brickel Amy L | $311,200 | |
| Previous Owner | Engel Stephen P | $257,933 |
Source: Public Records
Tax History Compared to Growth
Tax History
| Year | Tax Paid | Tax Assessment Tax Assessment Total Assessment is a certain percentage of the fair market value that is determined by local assessors to be the total taxable value of land and additions on the property. | Land | Improvement |
|---|---|---|---|---|
| 2024 | $6,424 | $560,100 | $126,400 | $433,700 |
| 2023 | $6,184 | $552,100 | $117,600 | $434,500 |
| 2022 | $5,663 | $487,800 | $104,800 | $383,000 |
| 2021 | $5,565 | $441,700 | $91,200 | $350,500 |
| 2020 | $5,294 | $352,900 | $80,000 | $272,900 |
| 2019 | $6,172 | $421,600 | $80,000 | $341,600 |
| 2018 | $5,802 | $382,200 | $72,000 | $310,200 |
| 2017 | $5,816 | $354,000 | $64,000 | $290,000 |
| 2016 | $4,176 | $266,000 | $64,000 | $202,000 |
| 2015 | $4,763 | $314,400 | $64,000 | $250,400 |
| 2014 | $4,466 | $314,400 | $64,000 | $250,400 |
| 2013 | -- | $314,400 | $64,000 | $250,400 |
Source: Public Records
Map
Nearby Homes
- 20 Buckfield Dr
- 17 Inland Farm Rd
- 81 Hall Rd
- 39 Varney Mill Rd
- 93 Nash Rd
- 4 Paxton Way Unit 4
- 31 Snowy Ridge Rd
- 22 Turkey Trail
- 5 Stagecoach Ln
- 7 Baxter Woods Trail
- Lot 14 Aerie Dr
- 2 Aerie Dr
- 16 Brookhaven Dr
- 8 Aerie Dr
- 1 Chipmunk Dr
- 3 Peavey Ave
- 219 Tandberg Trail
- 336 Pope Rd Unit 3
- 11 Dragonfly Dr
- 324 Roosevelt Trail Unit A-B
- 2 William Knight Rd
- 10 William Knight Rd
- 630 Gray Rd
- 636 Gray Rd
- 8 William Knight Rd
- 1 William Knight Rd
- 639 Gray Rd
- 631 Gray Rd
- 5 Wheeler Way
- 646 Gray Rd
- 637 Gray Rd
- 624 Gray Rd
- 16 William Knight Rd
- 4 Wheeler Way
- 12 William Knight Rd
- 11 Wheeler Way
- 5 Cornfield View
- 627 Gray Rd
- 15 Wheeler Way
- Lot #3 Wheeler Dr