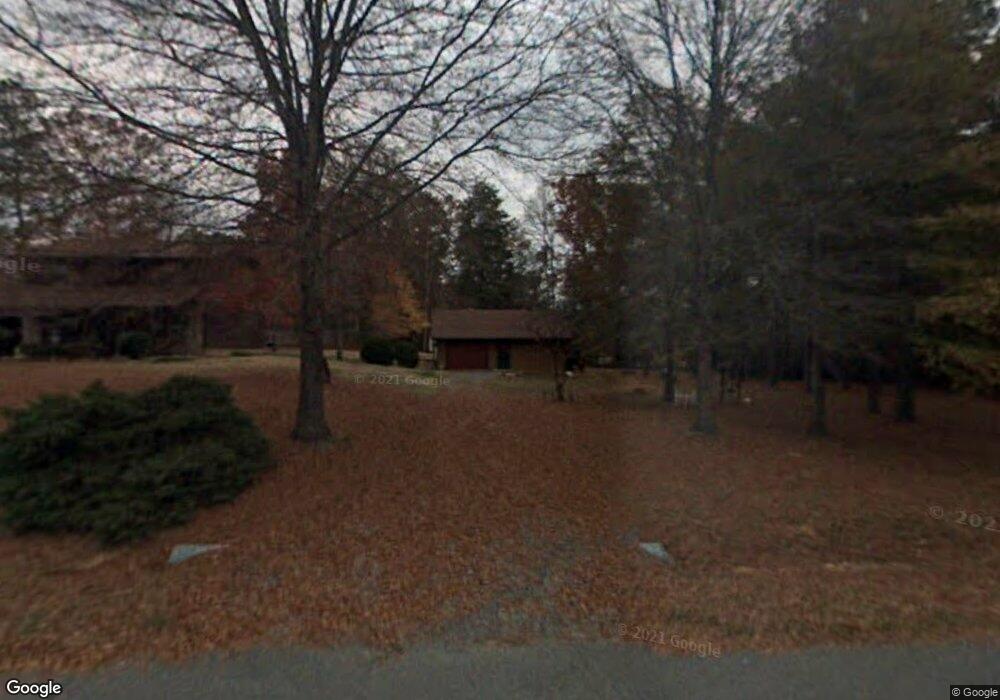
6 Willow Bend Rd NE Armuchee, GA 30105
Estimated Value: $238,000 - $260,552
--
Bed
1
Bath
1,349
Sq Ft
$185/Sq Ft
Est. Value
About This Home
This home is located at 6 Willow Bend Rd NE, Armuchee, GA 30105 and is currently estimated at $250,138, approximately $185 per square foot. 6 Willow Bend Rd NE is a home located in Floyd County with nearby schools including Bloomingdale Elementary School, Armuchee Middle School, and Armuchee High School.
Ownership History
Date
Name
Owned For
Owner Type
Purchase Details
Closed on
Dec 28, 2006
Sold by
Not Provided
Bought by
Gresham Gresham Jack W Jack W and Gresham Linda
Current Estimated Value
Purchase Details
Closed on
Mar 31, 2006
Sold by
Not Provided
Bought by
Gresham Gresham Jack W Jack W and Gresham Linda
Purchase Details
Closed on
Mar 17, 2004
Bought by
P and R
Purchase Details
Closed on
Jul 11, 1990
Sold by
Wigley Grady J and Wigley Cynthia S
Bought by
Lively James H and Lively Linda A
Purchase Details
Closed on
Oct 14, 1988
Sold by
Wigley Grady J and Wigley Cynthia S
Bought by
Wigley Grady J and Wigley Cynthia S
Purchase Details
Closed on
May 18, 1984
Sold by
Burk William F
Bought by
Wigley Grady J and Wigley Cynthia S
Purchase Details
Closed on
May 4, 1979
Bought by
Burk William Jr Builders Inc Burk Willia
Create a Home Valuation Report for This Property
The Home Valuation Report is an in-depth analysis detailing your home's value as well as a comparison with similar homes in the area
Home Values in the Area
Average Home Value in this Area
Purchase History
| Date | Buyer | Sale Price | Title Company |
|---|---|---|---|
| Gresham Gresham Jack W Jack W | $130,000 | -- | |
| Gresham Gresham Jack W Jack W | -- | -- | |
| P | -- | -- | |
| Lively James H | $76,000 | -- | |
| Wigley Grady J | -- | -- | |
| Wigley Grady J | $50,000 | -- | |
| Burk William F | $51,700 | -- | |
| Burk William Jr Builders Inc Burk Willia | -- | -- |
Source: Public Records
Tax History Compared to Growth
Tax History
| Year | Tax Paid | Tax Assessment Tax Assessment Total Assessment is a certain percentage of the fair market value that is determined by local assessors to be the total taxable value of land and additions on the property. | Land | Improvement |
|---|---|---|---|---|
| 2024 | $3,168 | $98,247 | $21,086 | $77,161 |
| 2023 | $2,971 | $87,245 | $19,169 | $68,076 |
| 2022 | $2,360 | $74,073 | $15,336 | $58,737 |
| 2021 | $2,103 | $64,459 | $15,336 | $49,123 |
| 2020 | $1,675 | $58,957 | $11,502 | $47,455 |
| 2019 | $1,716 | $52,495 | $11,502 | $40,993 |
| 2018 | $1,663 | $50,802 | $11,502 | $39,300 |
| 2017 | $1,641 | $49,977 | $11,502 | $38,475 |
| 2016 | $1,650 | $49,576 | $11,480 | $38,096 |
| 2015 | $1,623 | $50,096 | $11,480 | $38,616 |
| 2014 | $1,623 | $49,720 | $11,480 | $38,240 |
Source: Public Records
Map
Nearby Homes
- 1024 New Rosedale Rd NE
- 1085 New Rosedale Rd NE
- 1194 New Rosedale Rd NE
- 1603 Floyd Springs Rd NE
- 46 North Dr
- 311 Herring Rd NE
- 1465 Turner Rd NE
- 0 Highway 140 Unit 20164671
- 201 Kellett Rd NE
- 70 Old Summerville Rd
- 282 Turner Rd NE
- 334 Armuchee Trail NE
- 2324 Floyd Springs Rd NE
- 4494 Old Summerville Rd
- 12 Scenic Trace Dr NW
- 266 W Troutman Rd NE
- 0 Big Texas Valley Rd NW Unit 10420220
- 00 Westvalley Dr
- 0 Westvalley Dr NW Unit 10633217
- 0 Westvalley Dr NW Unit 7605181
- 0 Willow Bend Rd Unit 8247422
- 0 Willow Bend Rd Unit 8413454
- 0 Willow Bend Rd Unit 3190979
- 0 Willow Bend Rd
- 8 Willow Bend Rd NE
- 7 Willow Bend Rd NE
- 9 Willow Bend Rd NE
- 5 Willow Bend Rd NE
- 24 Southern Woods Dr NE
- 26 Southern Woods Dr NE
- 4 Willow Bend Rd NE Unit 49
- 4 Willow Bend Rd NE
- 22 Southern Woods Dr NE
- 28 Southern Woods Dr NE
- 20 Southern Woods Dr NE
- 27 Southern Woods Dr NE
- 30 Southern Woods Dr NE
- 30 Southern Woods Dr NE Unit 28
- 29 Southern Woods Dr NE
- 25 Southern Woods Dr NE