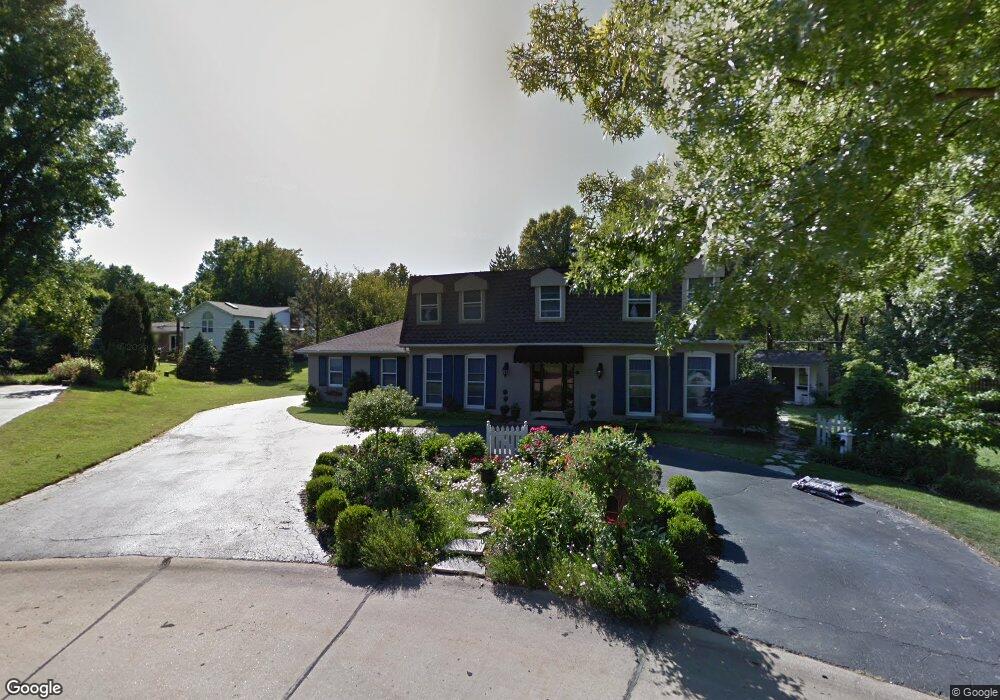
6 Woodbridge Park Rd Saint Louis, MO 63131
Estimated Value: $687,491 - $771,000
4
Beds
4
Baths
2,286
Sq Ft
$318/Sq Ft
Est. Value
About This Home
This home is located at 6 Woodbridge Park Rd, Saint Louis, MO 63131 and is currently estimated at $725,873, approximately $317 per square foot. 6 Woodbridge Park Rd is a home located in St. Louis County with nearby schools including Westchester Elementary School, North Kirkwood Middle School, and Kirkwood Senior High School.
Ownership History
Date
Name
Owned For
Owner Type
Purchase Details
Closed on
Feb 25, 2011
Sold by
Palmer Amy
Bought by
Coombes David J and Coombes Kristin S
Current Estimated Value
Home Financials for this Owner
Home Financials are based on the most recent Mortgage that was taken out on this home.
Original Mortgage
$361,550
Outstanding Balance
$246,812
Interest Rate
4.73%
Mortgage Type
VA
Estimated Equity
$479,061
Purchase Details
Closed on
Jul 22, 2010
Sold by
Palmer Robert and Palmer Heidi
Bought by
Palmer Amy
Purchase Details
Closed on
Jan 28, 2000
Sold by
Bram Gregory R and Bram Beth S
Bought by
Palmer Robert and Palmer Amy
Home Financials for this Owner
Home Financials are based on the most recent Mortgage that was taken out on this home.
Original Mortgage
$252,700
Interest Rate
8.27%
Purchase Details
Closed on
Jan 25, 1998
Sold by
Bram Gregory R and Bram Beth Ann S
Bought by
Trust Of Gregory R Bram and Trust Of Beth Ann S Bram
Create a Home Valuation Report for This Property
The Home Valuation Report is an in-depth analysis detailing your home's value as well as a comparison with similar homes in the area
Home Values in the Area
Average Home Value in this Area
Purchase History
| Date | Buyer | Sale Price | Title Company |
|---|---|---|---|
| Coombes David J | $350,000 | Ust | |
| Palmer Amy | -- | Ust | |
| Palmer Robert | $285,000 | -- | |
| Trust Of Gregory R Bram | -- | -- |
Source: Public Records
Mortgage History
| Date | Status | Borrower | Loan Amount |
|---|---|---|---|
| Open | Coombes David J | $361,550 | |
| Previous Owner | Palmer Robert | $252,700 |
Source: Public Records
Tax History Compared to Growth
Tax History
| Year | Tax Paid | Tax Assessment Tax Assessment Total Assessment is a certain percentage of the fair market value that is determined by local assessors to be the total taxable value of land and additions on the property. | Land | Improvement |
|---|---|---|---|---|
| 2025 | $6,057 | $122,160 | $68,500 | $53,660 |
| 2024 | $6,057 | $104,690 | $49,250 | $55,440 |
| 2023 | $5,963 | $104,690 | $49,250 | $55,440 |
| 2022 | $6,226 | $101,920 | $49,250 | $52,670 |
| 2021 | $6,159 | $101,920 | $49,250 | $52,670 |
| 2020 | $5,403 | $85,900 | $45,450 | $40,450 |
| 2019 | $5,410 | $85,900 | $45,450 | $40,450 |
| 2018 | $5,227 | $74,460 | $26,940 | $47,520 |
| 2017 | $5,241 | $74,460 | $26,940 | $47,520 |
| 2016 | $4,903 | $70,540 | $23,120 | $47,420 |
| 2015 | $4,909 | $70,540 | $23,120 | $47,420 |
| 2014 | $4,411 | $61,910 | $9,790 | $52,120 |
Source: Public Records
Map
Nearby Homes
- 1126 Bopp Rd
- 1090 Kinstern Dr
- 1029 Kinstern Dr
- 8 Briarbrook Trail
- 11913 Lillian Ave
- 11909 Lillian Ave
- 12006 Montour Dr
- 1345 Woodgate Dr
- 918 N Ballas Rd
- 811 Cherry St
- 12224 TBB Roger Ln
- 723 Oak Valley Dr
- 1728 Folkstone Dr
- 12439 Springdale Ln Unit TBB
- 1001 Dovergate Dr
- 1741 Pine Hill Dr
- 1710 Lynkirk Ln
- 11358 Manchester Rd
- 2000 Trailcrest Ln Unit 3
- The Hawthorne Plan at Ballas Ridge
- 5 Woodbridge Park Rd
- 12006 Sandalwood Ct
- 7 Woodbridge Park Rd
- 1304 Christine Ave
- 4 Woodbridge Park Rd
- 1318 Christine Ave
- 8 Woodbridge Park Rd
- 1300 Christine Ave
- 3 Woodbridge Park Rd
- 11949 Paradise Ln
- 11952 Paradise Ln
- 1326 Christine Ave
- 12000 Sandalwood Ct
- 1305 Bopp Rd
- 12007 Sandalwood Ct
- 1305 Christine Ave
- 1301 Christine Ave
- 1315 Christine Ave
- 12001 Sandalwood Ct
- 9 Woodbridge Park Rd