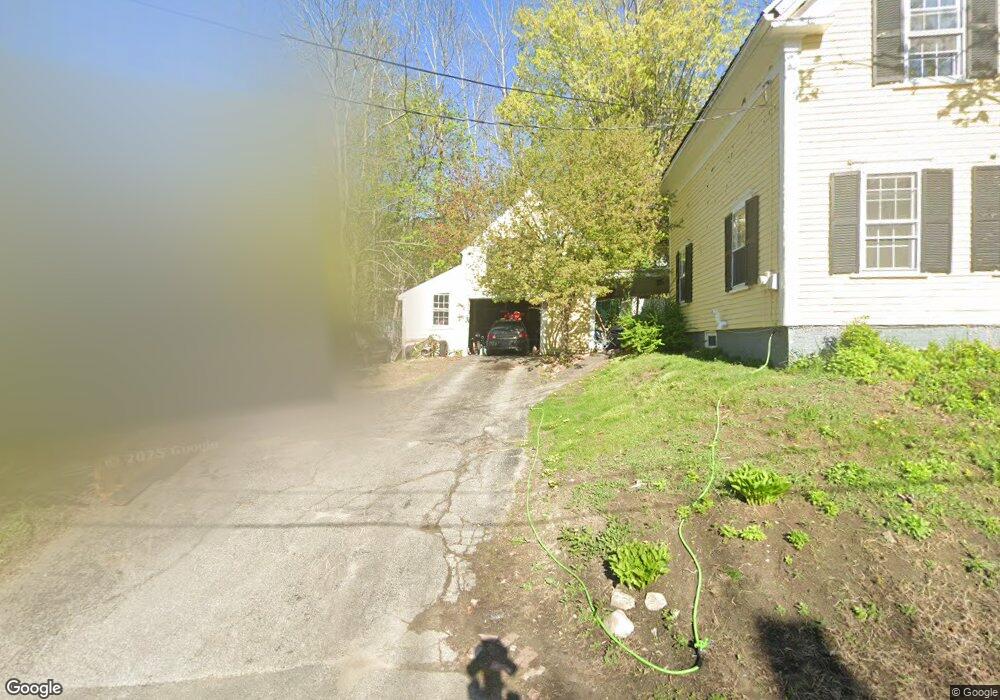
6 Wyman St Augusta, ME 04330
Estimated Value: $230,000 - $289,000
3
Beds
2
Baths
1,572
Sq Ft
$174/Sq Ft
Est. Value
About This Home
This home is located at 6 Wyman St, Augusta, ME 04330 and is currently estimated at $273,821, approximately $174 per square foot. 6 Wyman St is a home located in Kennebec County with nearby schools including Cony Middle School, Cony School, and St. Augustine School.
Ownership History
Date
Name
Owned For
Owner Type
Purchase Details
Closed on
Feb 26, 2013
Sold by
Wasserman Harvey and Wasserman Kimberly C
Bought by
Wasserman Kimberly C and Wasserman Harvey
Current Estimated Value
Purchase Details
Closed on
Oct 6, 2005
Sold by
Bernstein Cynthia R
Bought by
Wasserman Harvey and Collins Kimberly
Home Financials for this Owner
Home Financials are based on the most recent Mortgage that was taken out on this home.
Original Mortgage
$68,500
Outstanding Balance
$36,330
Interest Rate
5.81%
Mortgage Type
Purchase Money Mortgage
Estimated Equity
$237,491
Create a Home Valuation Report for This Property
The Home Valuation Report is an in-depth analysis detailing your home's value as well as a comparison with similar homes in the area
Home Values in the Area
Average Home Value in this Area
Purchase History
| Date | Buyer | Sale Price | Title Company |
|---|---|---|---|
| Wasserman Kimberly C | -- | -- | |
| Wasserman Kimberly C | -- | -- | |
| Wasserman Harvey | -- | -- | |
| Wasserman Harvey | -- | -- | |
| Wasserman Harvey | -- | -- |
Source: Public Records
Mortgage History
| Date | Status | Borrower | Loan Amount |
|---|---|---|---|
| Open | Wasserman Harvey | $68,500 | |
| Closed | Wasserman Harvey | $68,500 |
Source: Public Records
Tax History
| Year | Tax Paid | Tax Assessment Tax Assessment Total Assessment is a certain percentage of the fair market value that is determined by local assessors to be the total taxable value of land and additions on the property. | Land | Improvement |
|---|---|---|---|---|
| 2024 | $2,906 | $122,100 | $30,700 | $91,400 |
| 2023 | $2,803 | $122,100 | $30,700 | $91,400 |
| 2022 | $2,676 | $122,100 | $30,700 | $91,400 |
| 2021 | $2,557 | $122,100 | $30,700 | $91,400 |
| 2020 | $2,557 | $122,100 | $30,700 | $91,400 |
| 2019 | $2,560 | $122,100 | $30,700 | $91,400 |
| 2018 | $2,560 | $122,100 | $30,700 | $91,400 |
| 2017 | $2,488 | $122,100 | $30,700 | $91,400 |
| 2016 | $2,416 | $122,100 | $30,700 | $91,400 |
| 2015 | $2,175 | $122,100 | $30,700 | $91,400 |
| 2014 | $2,280 | $122,100 | $30,700 | $91,400 |
Source: Public Records
Map
Nearby Homes