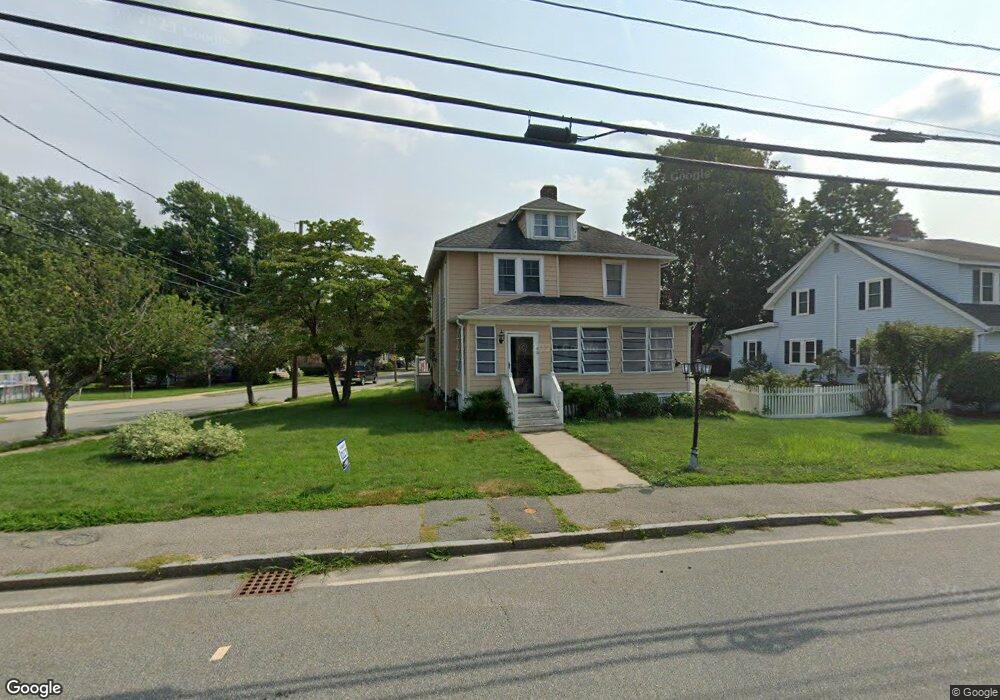
6 Wyman St Woburn, MA 01801
Downtown Woburn NeighborhoodEstimated Value: $671,000 - $870,000
4
Beds
2
Baths
1,887
Sq Ft
$413/Sq Ft
Est. Value
About This Home
This home is located at 6 Wyman St, Woburn, MA 01801 and is currently estimated at $779,707, approximately $413 per square foot. 6 Wyman St is a home located in Middlesex County with nearby schools including Wyman Elementary School, John F. Kennedy Middle School, and Woburn High School.
Ownership History
Date
Name
Owned For
Owner Type
Purchase Details
Closed on
Nov 17, 2020
Sold by
Mclaughlin Beverly
Bought by
Mclaughlin Donald J
Current Estimated Value
Purchase Details
Closed on
Mar 17, 2009
Sold by
Mourosas Theodore and Mourosas Kimberly A
Bought by
Mclaughlin John R and Mclaughlin Beverly
Purchase Details
Closed on
Dec 2, 1999
Sold by
Ciccarelli Paul C
Bought by
Mourousas Theodore and Mourousas Kimberly A
Purchase Details
Closed on
Jul 14, 1995
Sold by
Dudley Mary A and Gallagher Phillip J
Bought by
Ciccarelli Paul C
Create a Home Valuation Report for This Property
The Home Valuation Report is an in-depth analysis detailing your home's value as well as a comparison with similar homes in the area
Home Values in the Area
Average Home Value in this Area
Purchase History
| Date | Buyer | Sale Price | Title Company |
|---|---|---|---|
| Mclaughlin Donald J | -- | None Available | |
| Mclaughlin Donald J | -- | None Available | |
| Mclaughlin John R | $265,000 | -- | |
| Mclaughlin John R | $265,000 | -- | |
| Mourousas Theodore | $237,500 | -- | |
| Ciccarelli Paul C | $170,000 | -- |
Source: Public Records
Mortgage History
| Date | Status | Borrower | Loan Amount |
|---|---|---|---|
| Previous Owner | Ciccarelli Paul C | $30,500 | |
| Previous Owner | Ciccarelli Paul C | $245,650 |
Source: Public Records
Tax History Compared to Growth
Tax History
| Year | Tax Paid | Tax Assessment Tax Assessment Total Assessment is a certain percentage of the fair market value that is determined by local assessors to be the total taxable value of land and additions on the property. | Land | Improvement |
|---|---|---|---|---|
| 2025 | $5,419 | $634,600 | $320,600 | $314,000 |
| 2024 | $4,821 | $598,200 | $305,300 | $292,900 |
| 2023 | $4,853 | $557,800 | $277,600 | $280,200 |
| 2022 | $4,661 | $499,000 | $241,400 | $257,600 |
| 2021 | $4,285 | $459,300 | $229,900 | $229,400 |
| 2020 | $4,268 | $457,900 | $229,900 | $228,000 |
| 2019 | $4,197 | $441,800 | $218,900 | $222,900 |
| 2018 | $3,947 | $399,100 | $200,800 | $198,300 |
| 2017 | $3,745 | $376,800 | $191,300 | $185,500 |
| 2016 | $3,575 | $355,700 | $178,800 | $176,900 |
| 2015 | $3,385 | $332,800 | $167,100 | $165,700 |
| 2014 | $3,302 | $316,300 | $167,100 | $149,200 |
Source: Public Records
Map
Nearby Homes