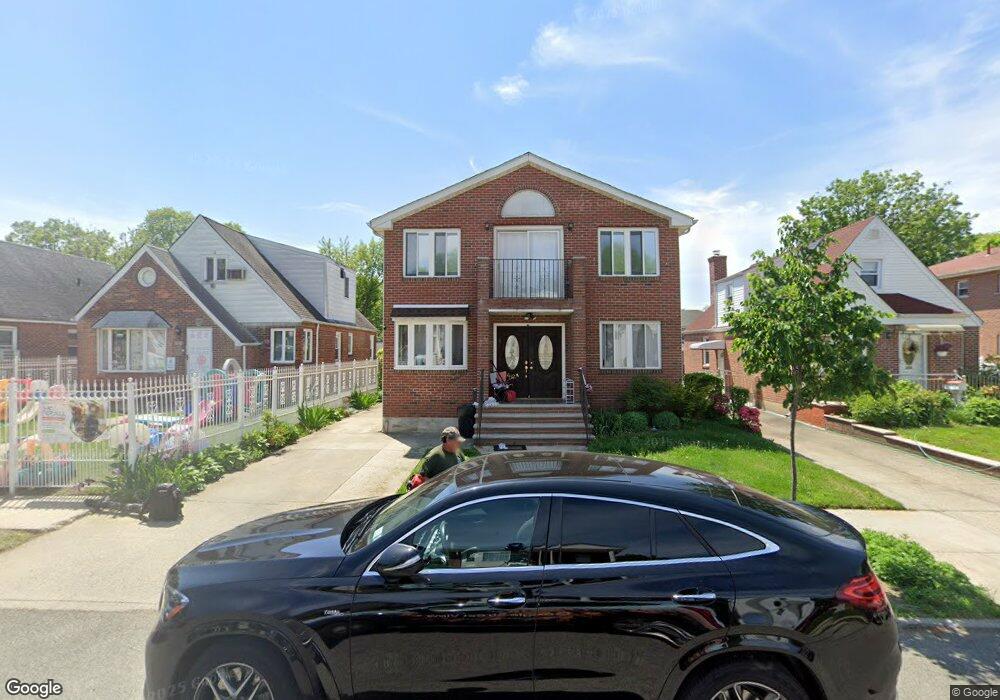
60-24 255th St Unit 2 fl Little Neck, NY 11362
Little Neck NeighborhoodEstimated Value: $1,289,348 - $1,731,000
3
Beds
2
Baths
1,998
Sq Ft
$767/Sq Ft
Est. Value
About This Home
This home is located at 60-24 255th St Unit 2 fl, Little Neck, NY 11362 and is currently estimated at $1,532,087, approximately $766 per square foot. 60-24 255th St Unit 2 fl is a home located in Queens County with nearby schools including P.S. 221Q The North Hills School, Louis Pasteur Middle School 67, and Benjamin N Cardozo High School.
Ownership History
Date
Name
Owned For
Owner Type
Purchase Details
Closed on
Apr 4, 2025
Sold by
Ara Nasrin and Arabi Nasrene
Bought by
Ara Nasrin and Nasrin Ara Revocable Trust
Current Estimated Value
Purchase Details
Closed on
May 31, 2014
Sold by
Arabi Nasrene and Vafai Habibolah
Bought by
Arabi Nasrene
Purchase Details
Closed on
May 20, 2005
Sold by
Coleman Ann
Bought by
Arabi Nasrene and Vafai Habibolah
Home Financials for this Owner
Home Financials are based on the most recent Mortgage that was taken out on this home.
Original Mortgage
$103,950
Interest Rate
5.83%
Purchase Details
Closed on
Dec 15, 2004
Sold by
Thaler Andrew M and Chapter 7 Bankruptcy Trustee Of Carol Ca
Bought by
Coleman Ann
Purchase Details
Closed on
Oct 29, 2000
Sold by
Delcolle John
Bought by
Delcolle Ralph J and Delcolle Raymond J
Create a Home Valuation Report for This Property
The Home Valuation Report is an in-depth analysis detailing your home's value as well as a comparison with similar homes in the area
Home Values in the Area
Average Home Value in this Area
Purchase History
| Date | Buyer | Sale Price | Title Company |
|---|---|---|---|
| Ara Nasrin | -- | -- | |
| Arabi Nasrene | $10,000 | -- | |
| Arabi Nasrene | $10,000 | -- | |
| Arabi Nasrene | $670,000 | -- | |
| Arabi Nasrene | $670,000 | -- | |
| Coleman Ann | -- | -- | |
| Coleman Ann | -- | -- | |
| Delcolle Ralph J | -- | Commonwealth Land Title Ins | |
| Delcolle Ralph J | -- | Commonwealth Land Title Ins |
Source: Public Records
Mortgage History
| Date | Status | Borrower | Loan Amount |
|---|---|---|---|
| Previous Owner | Arabi Nasrene | $103,950 | |
| Previous Owner | Arabi Nasrene | $499,000 | |
| Closed | Coleman Ann | $0 |
Source: Public Records
Tax History Compared to Growth
Tax History
| Year | Tax Paid | Tax Assessment Tax Assessment Total Assessment is a certain percentage of the fair market value that is determined by local assessors to be the total taxable value of land and additions on the property. | Land | Improvement |
|---|---|---|---|---|
| 2025 | $13,213 | $66,968 | $13,473 | $53,495 |
| 2024 | $6,606 | $65,784 | $13,029 | $52,755 |
| 2023 | $6,233 | $62,062 | $13,256 | $48,806 |
| 2022 | $5,844 | $88,860 | $18,300 | $70,560 |
| 2021 | $11,745 | $76,500 | $18,300 | $58,200 |
| 2020 | $11,813 | $76,320 | $18,300 | $58,020 |
| 2019 | $11,468 | $69,900 | $18,300 | $51,600 |
| 2018 | $10,543 | $51,718 | $14,096 | $37,622 |
| 2017 | $9,946 | $48,792 | $15,550 | $33,242 |
| 2016 | $9,297 | $48,792 | $15,550 | $33,242 |
| 2015 | $5,552 | $46,506 | $14,371 | $32,135 |
| 2014 | $5,552 | $45,684 | $16,944 | $28,740 |
Source: Public Records
Map
Nearby Homes
- 25328 60th Ave Unit 631
- 251-75 61st Ave Unit 2-701
- 61-03 255th St Unit 899
- 255-10 61st Ave Unit 907
- 252-15 60th Ave Unit 1-114
- 58-30 254th St
- 251-42 61st Ave Unit 1-1149
- 60-31 251st St Unit 2-814
- 61-25 255th St Unit 980
- 252- 51 63rd Ave Unit 5
- 252-23 63 Unit 1081
- 58-49 251st St Unit 1 Floor
- 253-12 58th Ave
- 252-33 63rd Ave Unit Upper Level
- 251-16 58th Ave Unit 1-25
- 60-58 251st St Unit 2
- 252-64 63rd Ave Unit 1
- 60-30 251st St Unit 1
- 6030 251st St Unit Upper
- 61-15 251st St Unit 1100
- 6024 255th St
- 6024 255th St Unit 1
- 6024 255th St Unit 2
- 6024 255th St Unit 1
- 60-24 255th St
- 60-24 255th St Unit 2
- 6024 255th St Unit 2
- 60-24 255th St Unit 2nd Fl
- 60-24 255th St Unit 1
- 60-24 255th St Unit 2F
- 6020 255th St
- 60-28 255th St
- 6028 255th St
- 6016 255th St
- 60-16 255th St Unit 1FL
- 60-16 255th St
- 60-16 255th St Unit 2Fl
- 6032 255th St
- 6012 255th St
- 60-36 255th St Unit 1