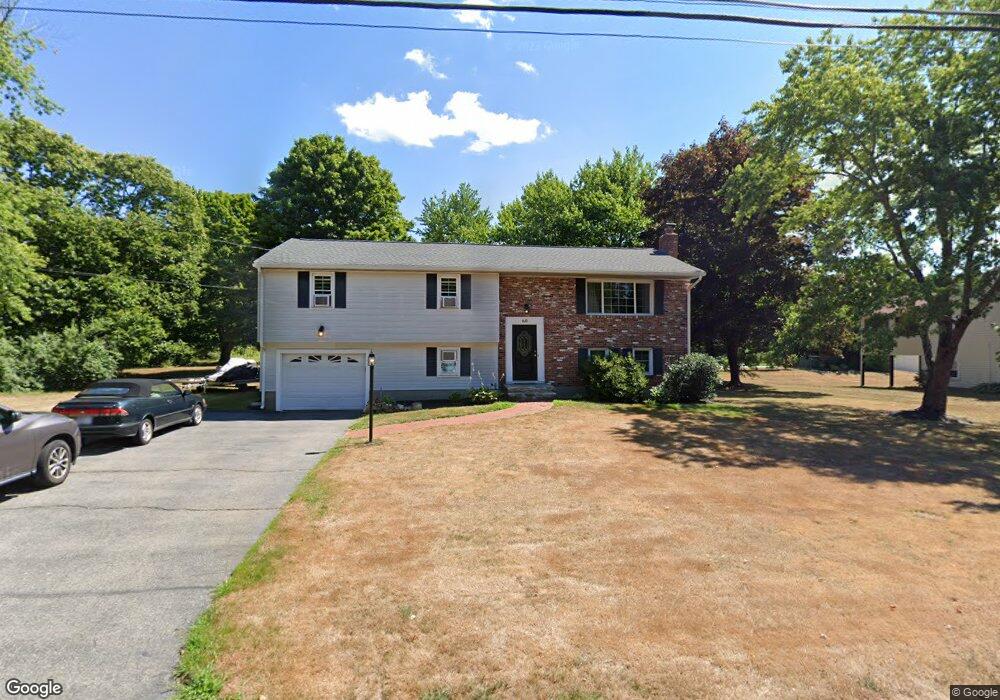
60 Bowman St Westborough, MA 01581
Estimated Value: $692,000 - $734,000
4
Beds
3
Baths
2,212
Sq Ft
$322/Sq Ft
Est. Value
About This Home
This home is located at 60 Bowman St, Westborough, MA 01581 and is currently estimated at $713,249, approximately $322 per square foot. 60 Bowman St is a home located in Worcester County with nearby schools including Westborough High School, Ebridge Montessori School, and Westboro Knowledge Beginnings.
Ownership History
Date
Name
Owned For
Owner Type
Purchase Details
Closed on
Oct 29, 2004
Sold by
Gamero Louis L and Gamero Rosario L
Bought by
Goyette Kevin W
Current Estimated Value
Home Financials for this Owner
Home Financials are based on the most recent Mortgage that was taken out on this home.
Original Mortgage
$289,700
Outstanding Balance
$144,184
Interest Rate
5.74%
Mortgage Type
Purchase Money Mortgage
Estimated Equity
$569,065
Purchase Details
Closed on
Nov 12, 1999
Sold by
Kim Boo Rea and Kim Seung B
Bought by
Gamero Louis L and Gamero Rosario L
Home Financials for this Owner
Home Financials are based on the most recent Mortgage that was taken out on this home.
Original Mortgage
$182,750
Interest Rate
7.68%
Mortgage Type
Purchase Money Mortgage
Purchase Details
Closed on
Jul 31, 1996
Sold by
Connor Richard M and Connor Marie
Bought by
Kim Seung and Kim Boo
Create a Home Valuation Report for This Property
The Home Valuation Report is an in-depth analysis detailing your home's value as well as a comparison with similar homes in the area
Home Values in the Area
Average Home Value in this Area
Purchase History
| Date | Buyer | Sale Price | Title Company |
|---|---|---|---|
| Goyette Kevin W | $362,125 | -- | |
| Gamero Louis L | $215,500 | -- | |
| Kim Seung | $187,000 | -- |
Source: Public Records
Mortgage History
| Date | Status | Borrower | Loan Amount |
|---|---|---|---|
| Open | Goyette Kevin W | $289,700 | |
| Previous Owner | Kim Seung | $214,500 | |
| Previous Owner | Kim Seung | $40,000 | |
| Previous Owner | Kim Seung | $182,750 |
Source: Public Records
Tax History Compared to Growth
Tax History
| Year | Tax Paid | Tax Assessment Tax Assessment Total Assessment is a certain percentage of the fair market value that is determined by local assessors to be the total taxable value of land and additions on the property. | Land | Improvement |
|---|---|---|---|---|
| 2025 | $9,406 | $577,400 | $338,000 | $239,400 |
| 2024 | $8,822 | $537,600 | $314,300 | $223,300 |
| 2023 | $8,600 | $510,700 | $297,900 | $212,800 |
| 2022 | $7,997 | $432,500 | $236,800 | $195,700 |
| 2021 | $7,596 | $409,700 | $211,000 | $198,700 |
| 2020 | $7,498 | $409,300 | $219,600 | $189,700 |
| 2019 | $7,112 | $388,000 | $219,600 | $168,400 |
| 2018 | $3,403 | $354,400 | $204,500 | $149,900 |
| 2017 | $6,308 | $354,400 | $204,500 | $149,900 |
| 2016 | $5,921 | $333,200 | $193,700 | $139,500 |
| 2015 | $5,893 | $317,000 | $193,700 | $123,300 |
Source: Public Records
Map
Nearby Homes