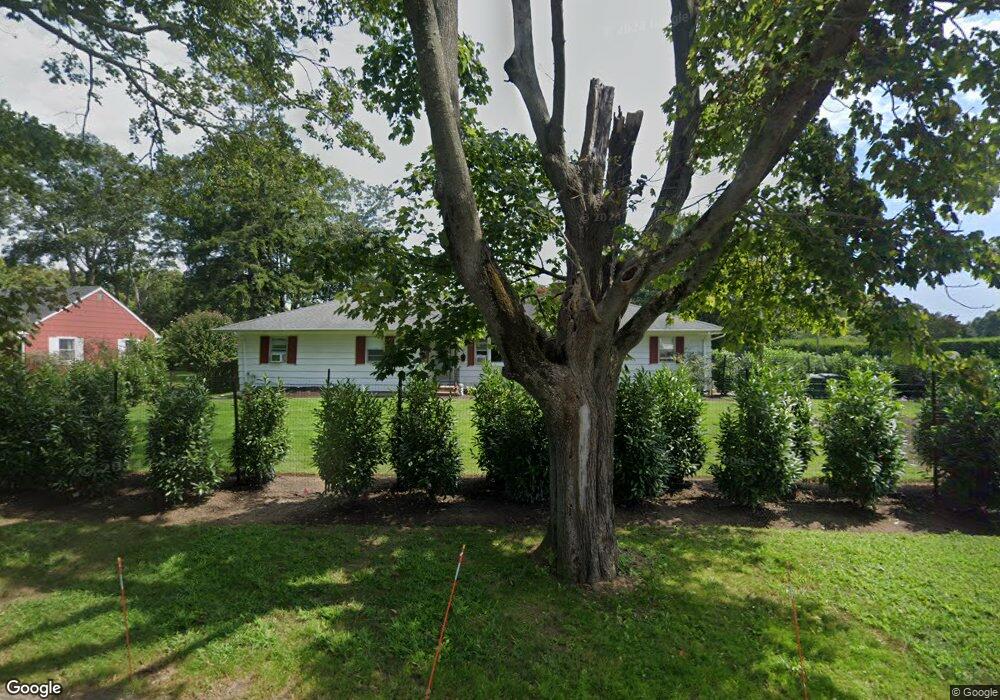
60 Breese Ln Southampton, NY 11968
Estimated Value: $2,089,000 - $3,410,000
3
Beds
2
Baths
1,506
Sq Ft
$1,799/Sq Ft
Est. Value
About This Home
This home is located at 60 Breese Ln, Southampton, NY 11968 and is currently estimated at $2,709,335, approximately $1,799 per square foot. 60 Breese Ln is a home located in Suffolk County with nearby schools including Southampton Elementary School, Southampton Intermediate School, and Southampton High School.
Ownership History
Date
Name
Owned For
Owner Type
Purchase Details
Closed on
Dec 15, 2022
Sold by
Sliwienski Patricia D
Bought by
Gabriella M Leff Lt and Leff
Current Estimated Value
Purchase Details
Closed on
May 29, 2021
Sold by
Patricia D Sliwienski Irt and Sliwienski
Bought by
Sliwienski Patricia D
Purchase Details
Closed on
May 26, 2020
Sold by
Sliwenski Patricia D
Bought by
Patricia D Sliwienski Irt and Sliwienski
Purchase Details
Closed on
Oct 31, 2019
Sold by
Sliwienski Edward A
Bought by
Sliwienski Patricia D
Create a Home Valuation Report for This Property
The Home Valuation Report is an in-depth analysis detailing your home's value as well as a comparison with similar homes in the area
Home Values in the Area
Average Home Value in this Area
Purchase History
| Date | Buyer | Sale Price | Title Company |
|---|---|---|---|
| Gabriella M Leff Lt | $2,000,000 | Stewart Title | |
| Sliwienski Patricia D | -- | None Available | |
| Patricia D Sliwienski Irt | -- | None Available | |
| Sliwienski Patricia D | -- | None Available |
Source: Public Records
Tax History Compared to Growth
Tax History
| Year | Tax Paid | Tax Assessment Tax Assessment Total Assessment is a certain percentage of the fair market value that is determined by local assessors to be the total taxable value of land and additions on the property. | Land | Improvement |
|---|---|---|---|---|
| 2024 | $1,678 | $1,493,800 | $1,251,500 | $242,300 |
| 2023 | $1,678 | $1,493,800 | $1,251,500 | $242,300 |
| 2022 | $3,436 | $1,493,800 | $1,251,500 | $242,300 |
| 2021 | $3,436 | $1,493,800 | $1,251,500 | $242,300 |
| 2020 | $3,328 | $1,493,800 | $1,251,500 | $242,300 |
| 2019 | $3,272 | $0 | $0 | $0 |
| 2018 | -- | $1,315,900 | $1,088,300 | $227,600 |
| 2017 | $1,695 | $1,315,900 | $1,088,300 | $227,600 |
| 2016 | $3,805 | $1,315,900 | $1,088,300 | $227,600 |
| 2015 | -- | $1,152,700 | $925,100 | $227,600 |
| 2014 | -- | $1,152,700 | $925,100 | $227,600 |
Source: Public Records
Map
Nearby Homes