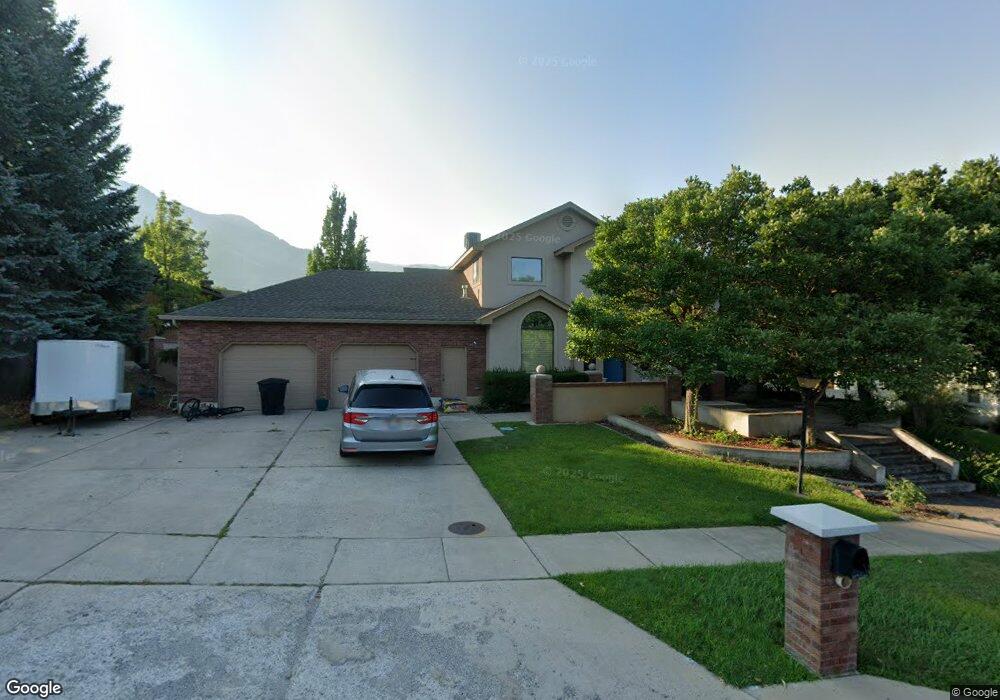
60 Bristol Rd Logan, UT 84341
Hillcrest NeighborhoodEstimated Value: $711,000 - $865,000
7
Beds
3
Baths
3,935
Sq Ft
$192/Sq Ft
Est. Value
About This Home
This home is located at 60 Bristol Rd, Logan, UT 84341 and is currently estimated at $754,110, approximately $191 per square foot. 60 Bristol Rd is a home located in Cache County with nearby schools including Hillcrest Elementary School, Mount Logan Middle School, and Logan High School.
Ownership History
Date
Name
Owned For
Owner Type
Purchase Details
Closed on
Jul 15, 2015
Sold by
Jenkins Benjamin and Jenkins Stephany
Bought by
Allred Robert T and Allred Melanie
Current Estimated Value
Home Financials for this Owner
Home Financials are based on the most recent Mortgage that was taken out on this home.
Original Mortgage
$316,445
Outstanding Balance
$247,090
Interest Rate
3.98%
Mortgage Type
New Conventional
Estimated Equity
$507,020
Purchase Details
Closed on
Sep 9, 2010
Sold by
Crookstone Garr J and Crookstone Nancy S
Bought by
Jenkins Benjamin and Jenkins Stephany
Home Financials for this Owner
Home Financials are based on the most recent Mortgage that was taken out on this home.
Original Mortgage
$46,500
Interest Rate
4.45%
Mortgage Type
Unknown
Create a Home Valuation Report for This Property
The Home Valuation Report is an in-depth analysis detailing your home's value as well as a comparison with similar homes in the area
Home Values in the Area
Average Home Value in this Area
Purchase History
| Date | Buyer | Sale Price | Title Company |
|---|---|---|---|
| Allred Robert T | -- | American Secure Title Logan | |
| Jenkins Benjamin | -- | Cache Title Company |
Source: Public Records
Mortgage History
| Date | Status | Borrower | Loan Amount |
|---|---|---|---|
| Open | Allred Robert T | $316,445 | |
| Previous Owner | Jenkins Benjamin | $46,500 | |
| Previous Owner | Jenkins Benjamin | $252,000 |
Source: Public Records
Tax History
| Year | Tax Paid | Tax Assessment Tax Assessment Total Assessment is a certain percentage of the fair market value that is determined by local assessors to be the total taxable value of land and additions on the property. | Land | Improvement |
|---|---|---|---|---|
| 2025 | $3,355 | $433,955 | $0 | $0 |
| 2024 | $3,464 | $433,955 | $0 | $0 |
| 2023 | $3,621 | $432,305 | $0 | $0 |
| 2022 | $3,458 | $385,555 | $0 | $0 |
| 2021 | $3,217 | $554,240 | $65,000 | $489,240 |
| 2020 | $3,049 | $472,700 | $65,000 | $407,700 |
| 2019 | $2,937 | $435,576 | $65,000 | $370,576 |
| 2018 | $2,799 | $379,048 | $65,000 | $314,048 |
| 2017 | $2,550 | $182,610 | $0 | $0 |
| 2016 | $2,644 | $182,610 | $0 | $0 |
| 2015 | $2,647 | $182,610 | $0 | $0 |
| 2014 | $1,998 | $152,435 | $0 | $0 |
| 2013 | -- | $152,435 | $0 | $0 |
Source: Public Records
Map
Nearby Homes
- 1454 N 1400 E
- 1336 E Talmage Ln Unit 38
- 1450 N 1525 E
- 1535 E 1385 N
- 1374 N 1250 E Unit 48
- 1440 N 1600 E
- 1354 N 1250 E Unit 46
- 1341 N 1250 E Unit 41
- 1512 E 1260 N
- 1357 E 1220 N
- 1133 N 1520 E
- 1720 N 1850 E
- 1586 N Sharptail Cir
- 1100 E 1900 N Unit 10
- 1902 E 1500 N
- 1782 E 1250 N
- 1901 Southpointe Ct
- 2025 N 1550 E
- 1405 N Aspen Dr
- 1451 N Aspen Dr
Your Personal Tour Guide
Ask me questions while you tour the home.