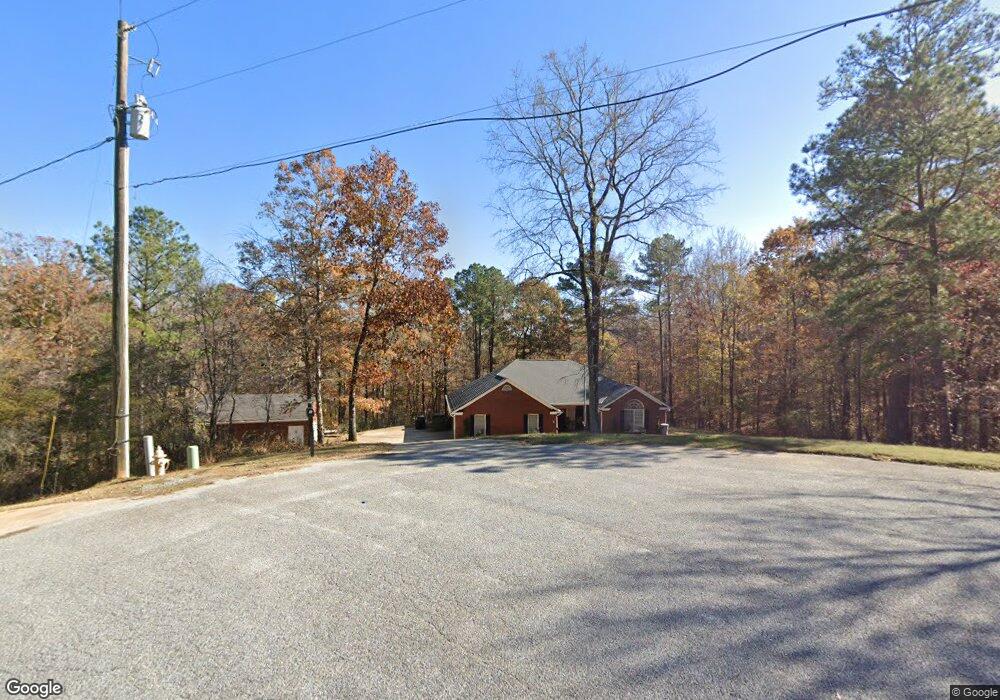
60 Camelia Ct Fortson, GA 31808
Estimated Value: $321,000 - $345,000
4
Beds
2
Baths
2,083
Sq Ft
$158/Sq Ft
Est. Value
About This Home
This home is located at 60 Camelia Ct, Fortson, GA 31808 and is currently estimated at $329,472, approximately $158 per square foot. 60 Camelia Ct is a home located in Harris County with nearby schools including New Mountain Hill Elementary School, Harris County Carver Middle School, and Harris County High School.
Ownership History
Date
Name
Owned For
Owner Type
Purchase Details
Closed on
Dec 3, 2010
Sold by
Silva Scott O and Silva Vickie A
Bought by
Pagels William P and Pagels Alma V
Current Estimated Value
Home Financials for this Owner
Home Financials are based on the most recent Mortgage that was taken out on this home.
Original Mortgage
$160,000
Outstanding Balance
$3,602
Interest Rate
4.32%
Mortgage Type
New Conventional
Estimated Equity
$325,870
Purchase Details
Closed on
Jul 13, 2006
Sold by
Tant Jennifer L
Bought by
Silva Scott O and Silva Vickie A
Home Financials for this Owner
Home Financials are based on the most recent Mortgage that was taken out on this home.
Original Mortgage
$164,000
Interest Rate
6.88%
Mortgage Type
New Conventional
Purchase Details
Closed on
Apr 6, 2006
Sold by
Bohannon Deidre D
Bought by
Tant Jennifer L
Purchase Details
Closed on
Feb 15, 2002
Sold by
Daniel Hodge Homes Inc
Bought by
Tant Jennifer L and Bohannon Deidra D
Purchase Details
Closed on
Feb 27, 2001
Bought by
Daniel Hodge Homes Inc
Create a Home Valuation Report for This Property
The Home Valuation Report is an in-depth analysis detailing your home's value as well as a comparison with similar homes in the area
Home Values in the Area
Average Home Value in this Area
Purchase History
| Date | Buyer | Sale Price | Title Company |
|---|---|---|---|
| Pagels William P | $201,000 | -- | |
| Silva Scott O | $205,000 | -- | |
| Tant Jennifer L | $8,000 | -- | |
| Tant Jennifer L | $166,000 | -- | |
| Daniel Hodge Homes Inc | $25,900 | -- |
Source: Public Records
Mortgage History
| Date | Status | Borrower | Loan Amount |
|---|---|---|---|
| Open | Pagels William P | $160,000 | |
| Previous Owner | Silva Scott O | $164,000 | |
| Previous Owner | Silva Scott O | $41,000 |
Source: Public Records
Tax History Compared to Growth
Tax History
| Year | Tax Paid | Tax Assessment Tax Assessment Total Assessment is a certain percentage of the fair market value that is determined by local assessors to be the total taxable value of land and additions on the property. | Land | Improvement |
|---|---|---|---|---|
| 2024 | $2,757 | $101,779 | $12,000 | $89,779 |
| 2023 | $2,463 | $90,748 | $12,000 | $78,748 |
| 2022 | $2,463 | $90,748 | $12,000 | $78,748 |
| 2021 | $2,393 | $85,048 | $12,000 | $73,048 |
| 2020 | $2,236 | $79,360 | $12,000 | $67,360 |
| 2019 | $2,157 | $79,360 | $12,000 | $67,360 |
| 2018 | $2,146 | $77,360 | $10,000 | $67,360 |
| 2017 | $2,147 | $77,360 | $10,000 | $67,360 |
| 2016 | $1,955 | $77,024 | $10,000 | $67,024 |
| 2015 | $1,959 | $77,024 | $10,000 | $67,024 |
| 2014 | $1,892 | $74,182 | $10,000 | $64,182 |
| 2013 | -- | $74,182 | $10,000 | $64,182 |
Source: Public Records
Map
Nearby Homes
- 142 Richardson Ct
- 160 Birchwood Dr
- 1159 James Rd
- 32 Linden Ave
- 57 Hart Ridge Ct
- 140 Cypress Trail
- 13 Morus Ln
- 31 Morus Ln
- 400 Burdette Rd
- The Stallworth at Mulberry Grove Plan at Mulberry Grove
- The Highland at Mulberry Grove Plan at Mulberry Grove
- The Summerville at Mulberry Grove Plan at Mulberry Grove
- The Emberly at Mulberry Grove Plan at Mulberry Grove
- The Winchester at Mulberry Grove Plan at Mulberry Grove
- The Mayfair at Mulberry Grove Plan at Mulberry Grove
- The Dogwood II at Mulberry Grove Plan at Mulberry Grove
- The Huddlestone II at Mulberry Grove Plan at Mulberry Grove
- The Walden at Mulberry Grove Plan at Mulberry Grove
- The Morningside II at Mulberry Grove Plan at Mulberry Grove
- The St James at Mulberry Grove Plan at Mulberry Grove
- 431 Rosewood Dr
- 407 Rosewood Dr
- 62 Camelia Ct
- 477 Rosewood Dr
- 72 Slash Pine Ct
- 424 Rosewood Dr
- 127 Richardson Ct
- 102 Stoney Ct
- 339 Rosewood Dr
- 68 Slash Pine Ct
- 406 Rosewood Dr
- 478 Rosewood Dr
- 507 Rosewood Dr
- 105 Stoney Ct
- 16 Slash Pine Ct
- 344 Rosewood Dr
- 62 Birchwood Dr
- 513 Rosewood Dr
- 593 Morton Ct
- 45 Slash Pine Ct