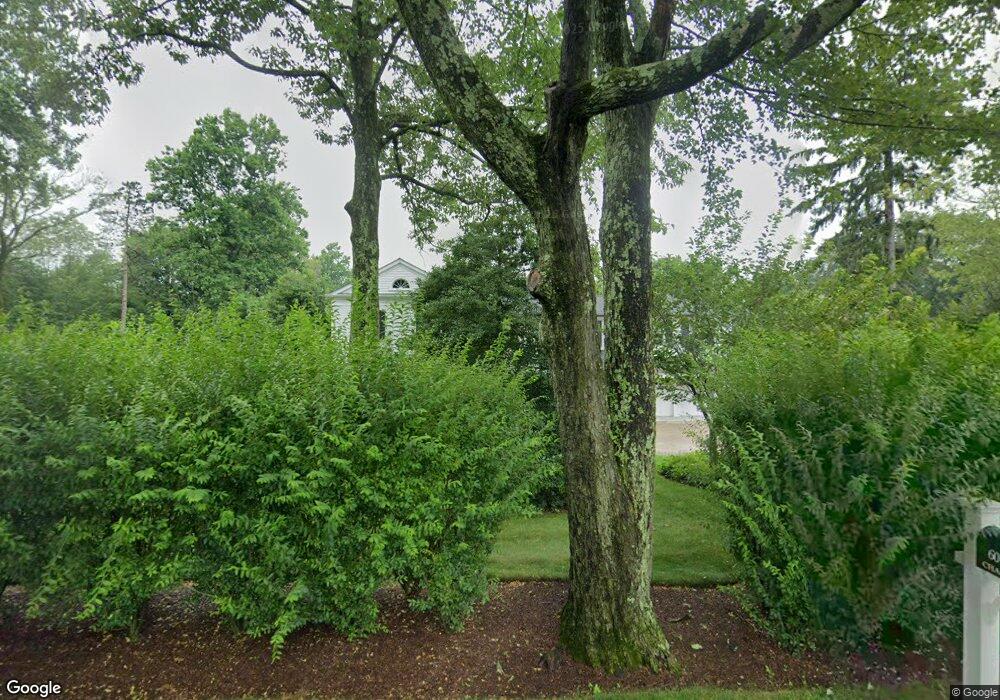
60 Chapin Rd Bernardsville, NJ 07924
Estimated Value: $1,915,000 - $2,288,040
--
Bed
--
Bath
4,711
Sq Ft
$435/Sq Ft
Est. Value
About This Home
This home is located at 60 Chapin Rd, Bernardsville, NJ 07924 and is currently estimated at $2,048,680, approximately $434 per square foot. 60 Chapin Rd is a home located in Somerset County with nearby schools including Bernardsville Middle School, Bernards High School, and The School of Saint Elizabeth.
Ownership History
Date
Name
Owned For
Owner Type
Purchase Details
Closed on
Aug 17, 2016
Sold by
Envision 2015 Llc
Bought by
Envision 2015 Llc
Current Estimated Value
Purchase Details
Closed on
Apr 16, 2015
Sold by
Wentworth Mark and Wentworth Mark X
Bought by
Envision 2012 Llc
Purchase Details
Closed on
Apr 25, 2011
Sold by
Dangelo Christopher Scott and Veghte Robert I
Bought by
Wentworth Mark
Create a Home Valuation Report for This Property
The Home Valuation Report is an in-depth analysis detailing your home's value as well as a comparison with similar homes in the area
Home Values in the Area
Average Home Value in this Area
Purchase History
| Date | Buyer | Sale Price | Title Company |
|---|---|---|---|
| Envision 2015 Llc | -- | None Available | |
| Envision 2012 Llc | $1,825,000 | None Available | |
| Wentworth Mark | -- | None Available | |
| Wentworth Mark | $1,040,000 | None Available |
Source: Public Records
Tax History Compared to Growth
Tax History
| Year | Tax Paid | Tax Assessment Tax Assessment Total Assessment is a certain percentage of the fair market value that is determined by local assessors to be the total taxable value of land and additions on the property. | Land | Improvement |
|---|---|---|---|---|
| 2025 | $36,684 | $2,026,100 | $774,100 | $1,252,000 |
| 2024 | $36,684 | $1,876,400 | $710,200 | $1,166,200 |
| 2023 | $35,395 | $1,761,800 | $663,700 | $1,098,100 |
| 2022 | $35,127 | $1,708,500 | $644,500 | $1,064,000 |
| 2021 | $34,672 | $1,666,000 | $644,500 | $1,021,500 |
| 2020 | $34,007 | $1,616,300 | $644,500 | $971,800 |
| 2019 | $34,787 | $1,706,900 | $694,500 | $1,012,400 |
| 2018 | $26,825 | $1,347,300 | $744,500 | $602,800 |
| 2017 | $27,200 | $1,411,500 | $784,500 | $627,000 |
| 2016 | $26,771 | $1,427,000 | $803,000 | $624,000 |
| 2015 | $20,488 | $1,115,300 | $803,000 | $312,300 |
| 2014 | $20,488 | $1,120,200 | $818,000 | $302,200 |
Source: Public Records
Map
Nearby Homes