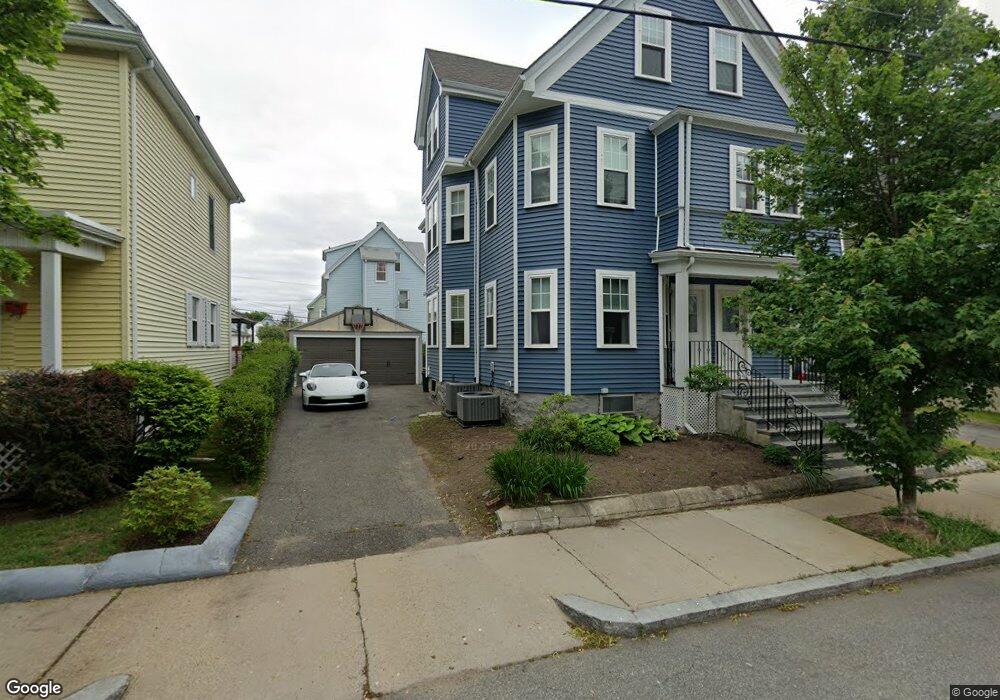
60 Claremont St Unit 62 Malden, MA 02148
Linden NeighborhoodEstimated Value: $815,000 - $1,219,000
5
Beds
2
Baths
2,426
Sq Ft
$428/Sq Ft
Est. Value
About This Home
This home is located at 60 Claremont St Unit 62, Malden, MA 02148 and is currently estimated at $1,037,853, approximately $427 per square foot. 60 Claremont St Unit 62 is a home located in Middlesex County with nearby schools including Malden High School and Malden Catholic.
Ownership History
Date
Name
Owned For
Owner Type
Purchase Details
Closed on
Oct 14, 2011
Sold by
Kelly Eileen and Cornoni Patricia
Bought by
Truong Vu
Current Estimated Value
Home Financials for this Owner
Home Financials are based on the most recent Mortgage that was taken out on this home.
Original Mortgage
$295,311
Outstanding Balance
$201,608
Interest Rate
4.12%
Mortgage Type
FHA
Estimated Equity
$836,245
Purchase Details
Closed on
Mar 14, 2011
Sold by
Kelly Eileen
Bought by
Malden City Of
Create a Home Valuation Report for This Property
The Home Valuation Report is an in-depth analysis detailing your home's value as well as a comparison with similar homes in the area
Home Values in the Area
Average Home Value in this Area
Purchase History
| Date | Buyer | Sale Price | Title Company |
|---|---|---|---|
| Truong Vu | $307,777 | -- | |
| Malden City Of | $5,601 | -- |
Source: Public Records
Mortgage History
| Date | Status | Borrower | Loan Amount |
|---|---|---|---|
| Open | Truong Vu | $295,311 |
Source: Public Records
Tax History Compared to Growth
Tax History
| Year | Tax Paid | Tax Assessment Tax Assessment Total Assessment is a certain percentage of the fair market value that is determined by local assessors to be the total taxable value of land and additions on the property. | Land | Improvement |
|---|---|---|---|---|
| 2025 | $105 | $926,500 | $265,600 | $660,900 |
| 2024 | $10,170 | $870,000 | $250,000 | $620,000 |
| 2023 | $7,249 | $594,700 | $226,600 | $368,100 |
| 2022 | $6,963 | $563,800 | $207,000 | $356,800 |
| 2021 | $6,785 | $552,100 | $195,300 | $356,800 |
| 2020 | $6,495 | $513,400 | $180,500 | $332,900 |
| 2019 | $6,321 | $476,300 | $171,900 | $304,400 |
| 2018 | $6,069 | $430,700 | $142,600 | $288,100 |
| 2017 | $5,917 | $417,600 | $142,600 | $275,000 |
| 2016 | $5,609 | $370,000 | $130,900 | $239,100 |
| 2015 | $5,388 | $342,500 | $124,600 | $217,900 |
| 2014 | $5,020 | $311,800 | $113,300 | $198,500 |
Source: Public Records
Map
Nearby Homes
- 19 Bellvale St
- 1135 Salem St
- 33 Blaine St
- 363 Broadway
- 4 Anderson Way Unit 2
- 75 Goldie St
- 48 Summit St
- 36 Central Ave
- 770 Washington Ave Unit 405
- 563 Lynn St
- 14 Dodge St
- 98 Summit St
- 32 Delta Terrace
- 33 Lodgen Ct Unit 4G
- 690 Washington Ave
- 112 Hadley St
- 82 Elwell St
- 18 Lynn St
- 26 Webber St Unit 1
- 35-35B Beachview Ave
- 66 Claremont St Unit 68
- 58 Claremont St
- 63 Maynard St
- 59 Maynard St Unit 61
- 54 Claremont St
- 55 Maynard St
- 71 Maynard St Unit 1
- 71 Maynard St
- 61 Claremont St
- 72 Claremont St
- 52 Claremont St
- 65 Claremont St
- 67 Maynard St
- 51 Maynard St
- 55 Claremont St Unit 57
- 51-53 Claremont St
- 51 Claremont St Unit 53
- 51 Claremont St Unit 3
- 76 Claremont St
- 44 Claremont St