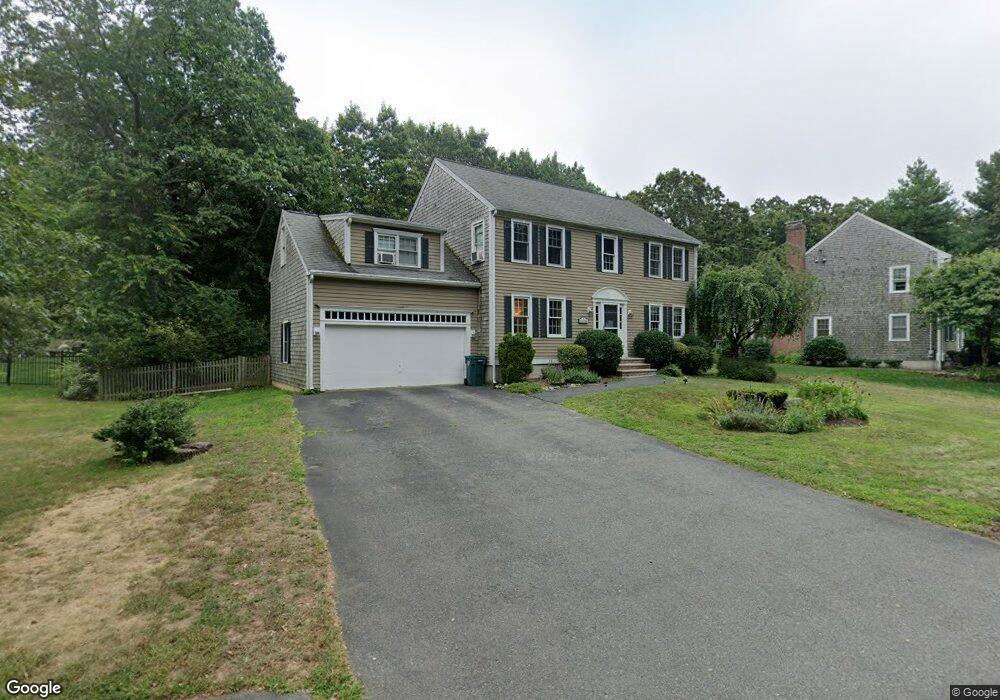
60 Dale St Abington, MA 02351
Estimated Value: $771,000 - $912,000
4
Beds
3
Baths
999
Sq Ft
$831/Sq Ft
Est. Value
About This Home
This home is located at 60 Dale St, Abington, MA 02351 and is currently estimated at $829,817, approximately $830 per square foot. 60 Dale St is a home located in Plymouth County with nearby schools including Woodsdale School, Beaver Brook Elementary School, and Abington Middle School.
Ownership History
Date
Name
Owned For
Owner Type
Purchase Details
Closed on
Oct 10, 2018
Sold by
Woods Erin M and Woods Michael F
Bought by
Woods Erin M
Current Estimated Value
Purchase Details
Closed on
Dec 1, 2000
Sold by
Fuller Richard S and Fuller Kelly A
Bought by
Woods Erin M
Purchase Details
Closed on
Sep 30, 1999
Sold by
Doolin Kenneth W and Doolin Karin M
Bought by
Fuller Richard S and Fuller Kelly A
Purchase Details
Closed on
Dec 31, 1996
Sold by
Macdonald Jacqueline B and Mclaughlin James F
Bought by
Doolin Kenneth W and Doolin Karin M
Create a Home Valuation Report for This Property
The Home Valuation Report is an in-depth analysis detailing your home's value as well as a comparison with similar homes in the area
Home Values in the Area
Average Home Value in this Area
Purchase History
| Date | Buyer | Sale Price | Title Company |
|---|---|---|---|
| Woods Erin M | -- | -- | |
| Woods Erin M | $357,500 | -- | |
| Fuller Richard S | $325,000 | -- | |
| Doolin Kenneth W | $225,000 | -- |
Source: Public Records
Mortgage History
| Date | Status | Borrower | Loan Amount |
|---|---|---|---|
| Previous Owner | Doolin Kenneth W | $150,000 | |
| Previous Owner | Doolin Kenneth W | $281,000 |
Source: Public Records
Tax History Compared to Growth
Tax History
| Year | Tax Paid | Tax Assessment Tax Assessment Total Assessment is a certain percentage of the fair market value that is determined by local assessors to be the total taxable value of land and additions on the property. | Land | Improvement |
|---|---|---|---|---|
| 2025 | $9,535 | $730,100 | $259,200 | $470,900 |
| 2024 | $9,662 | $722,100 | $264,600 | $457,500 |
| 2023 | $9,063 | $637,800 | $231,100 | $406,700 |
| 2022 | $8,866 | $582,500 | $189,200 | $393,300 |
| 2021 | $8,654 | $525,100 | $203,100 | $322,000 |
| 2020 | $8,299 | $488,200 | $174,300 | $313,900 |
| 2019 | $8,347 | $480,000 | $174,300 | $305,700 |
| 2018 | $7,948 | $446,000 | $174,300 | $271,700 |
| 2017 | $7,975 | $434,600 | $174,300 | $260,300 |
| 2016 | $7,439 | $414,900 | $166,400 | $248,500 |
| 2015 | $6,854 | $403,200 | $166,400 | $236,800 |
Source: Public Records
Map
Nearby Homes
- 1085 Bedford St
- 337 Randolph St
- 1077 Bedford St
- 14 Jamieson St
- 44 Old Forge Rd
- 5 Chamberlain St
- 57 Sheri Ln
- 28 Sylvan Ct
- 250 Thicket St
- 14 Kingswood Dr Unit 3
- 1353 Washington St
- 120 Glen St
- 0 Bedford St
- 29 West St
- 57 Battery St
- 840 Hancock St
- 1210 Washington St
- 451 Lincoln St
- 676 Bedford St
- 130 Trotter Rd Unit 1309