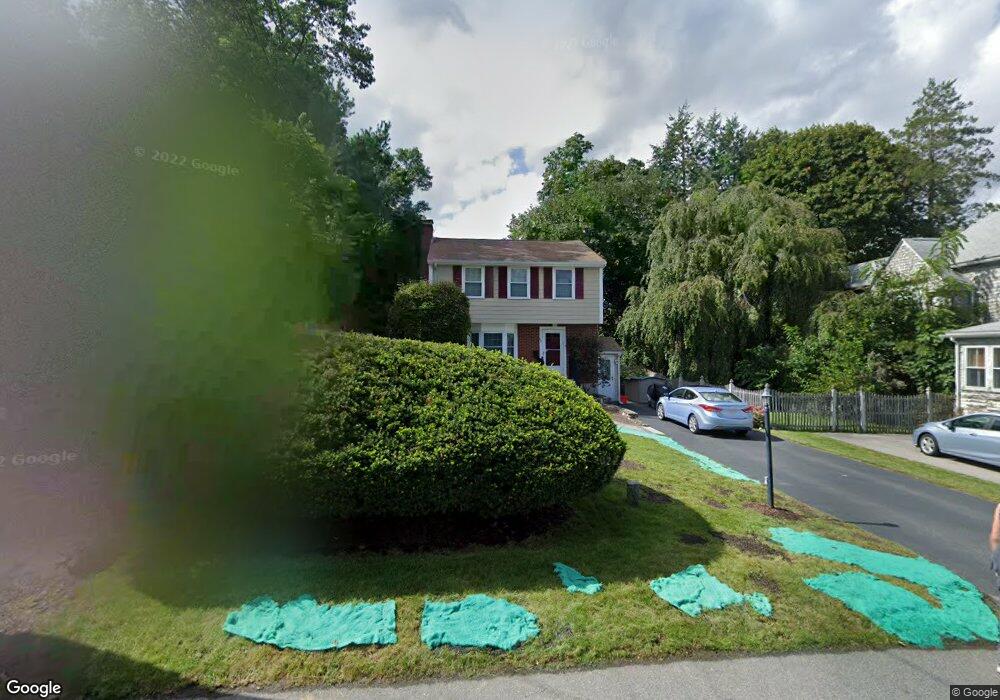
60 Deering St Reading, MA 01867
Estimated Value: $870,668 - $1,307,000
3
Beds
2
Baths
2,157
Sq Ft
$492/Sq Ft
Est. Value
About This Home
This home is located at 60 Deering St, Reading, MA 01867 and is currently estimated at $1,061,167, approximately $491 per square foot. 60 Deering St is a home located in Middlesex County with nearby schools including Birch Meadow Elementary School, Walter S. Parker Middle School, and Reading Memorial High School.
Ownership History
Date
Name
Owned For
Owner Type
Purchase Details
Closed on
Jul 29, 2004
Sold by
Murray Elizabeth L and Murray Kevin C
Bought by
Clarkson Daniel C and Clarkson Kimberlee A
Current Estimated Value
Purchase Details
Closed on
Jul 30, 1999
Sold by
Farley Christopher W and Farley Elizabeth P
Bought by
Murray Kevin C and Murray Elizabeth L
Purchase Details
Closed on
Dec 14, 1995
Sold by
Schmidt Martin A and Schmidt Lynda W
Bought by
Farley Christopher W and Farley Elizabeth P
Purchase Details
Closed on
Jun 23, 1989
Sold by
Hornbaker Nancy A
Bought by
Schmidt Martin A
Create a Home Valuation Report for This Property
The Home Valuation Report is an in-depth analysis detailing your home's value as well as a comparison with similar homes in the area
Home Values in the Area
Average Home Value in this Area
Purchase History
| Date | Buyer | Sale Price | Title Company |
|---|---|---|---|
| Clarkson Daniel C | $427,000 | -- | |
| Murray Kevin C | $258,000 | -- | |
| Farley Christopher W | $189,000 | -- | |
| Schmidt Martin A | $184,000 | -- |
Source: Public Records
Mortgage History
| Date | Status | Borrower | Loan Amount |
|---|---|---|---|
| Closed | Schmidt Martin A | $10,000 | |
| Open | Schmidt Martin A | $315,500 |
Source: Public Records
Tax History Compared to Growth
Tax History
| Year | Tax Paid | Tax Assessment Tax Assessment Total Assessment is a certain percentage of the fair market value that is determined by local assessors to be the total taxable value of land and additions on the property. | Land | Improvement |
|---|---|---|---|---|
| 2025 | $8,399 | $737,400 | $443,600 | $293,800 |
| 2024 | $8,496 | $724,900 | $436,100 | $288,800 |
| 2023 | $8,601 | $683,200 | $410,900 | $272,300 |
| 2022 | $8,334 | $625,200 | $375,900 | $249,300 |
| 2021 | $14,885 | $560,200 | $324,200 | $236,000 |
| 2020 | $7,564 | $542,200 | $313,700 | $228,500 |
| 2019 | $7,235 | $508,400 | $294,100 | $214,300 |
| 2018 | $14,127 | $484,100 | $280,000 | $204,100 |
| 2017 | $6,022 | $429,200 | $261,400 | $167,800 |
| 2016 | $6,067 | $418,400 | $262,400 | $156,000 |
| 2015 | $5,855 | $398,300 | $249,800 | $148,500 |
| 2014 | $5,463 | $370,600 | $232,400 | $138,200 |
Source: Public Records
Map
Nearby Homes
- 195 Lowell St
- 42 Winthrop Ave
- 77 Mount Vernon St
- 103 High St
- 5 Washington St Unit B2
- 52 Sanborn St Unit 408
- 16 Glen Rd
- 856 Main St
- 863 Main St
- 1 Charles St Unit N
- 52 Salem St
- 101 King St Unit 101
- 266 West St
- 48 Village St Unit 1001
- 35 Park Ave
- 24 Minot St
- 223 Washington St
- 25 Martin Rd
- 33 Marla Ln
- 28 Martin Rd