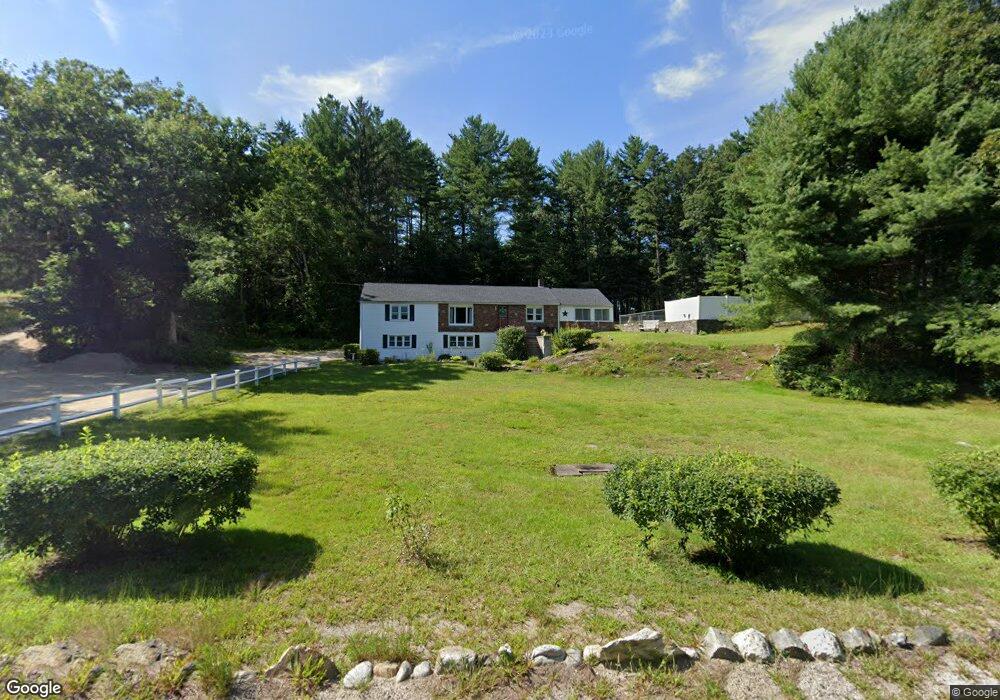
60 Dudley Rd Oxford, MA 01540
Estimated Value: $442,000 - $490,000
2
Beds
1
Bath
1,632
Sq Ft
$283/Sq Ft
Est. Value
About This Home
This home is located at 60 Dudley Rd, Oxford, MA 01540 and is currently estimated at $461,849, approximately $282 per square foot. 60 Dudley Rd is a home located in Worcester County with nearby schools including Alfred M Chaffee, Oxford High School, and Clara Barton Elementary School.
Ownership History
Date
Name
Owned For
Owner Type
Purchase Details
Closed on
Jul 12, 2007
Sold by
Hull Frederick A and Hull Irene T
Bought by
Rawson Jody L and Rawson Laura A
Current Estimated Value
Home Financials for this Owner
Home Financials are based on the most recent Mortgage that was taken out on this home.
Original Mortgage
$70,000
Outstanding Balance
$43,707
Interest Rate
6.48%
Mortgage Type
Purchase Money Mortgage
Estimated Equity
$418,142
Create a Home Valuation Report for This Property
The Home Valuation Report is an in-depth analysis detailing your home's value as well as a comparison with similar homes in the area
Home Values in the Area
Average Home Value in this Area
Purchase History
| Date | Buyer | Sale Price | Title Company |
|---|---|---|---|
| Rawson Jody L | $270,000 | -- |
Source: Public Records
Mortgage History
| Date | Status | Borrower | Loan Amount |
|---|---|---|---|
| Open | Rawson Jody L | $70,000 |
Source: Public Records
Tax History Compared to Growth
Tax History
| Year | Tax Paid | Tax Assessment Tax Assessment Total Assessment is a certain percentage of the fair market value that is determined by local assessors to be the total taxable value of land and additions on the property. | Land | Improvement |
|---|---|---|---|---|
| 2025 | $50 | $392,600 | $94,700 | $297,900 |
| 2024 | $4,715 | $349,800 | $88,000 | $261,800 |
| 2023 | $4,455 | $326,600 | $78,600 | $248,000 |
| 2022 | $4,076 | $252,200 | $67,200 | $185,000 |
| 2021 | $3,797 | $229,700 | $63,700 | $166,000 |
| 2020 | $3,669 | $220,200 | $63,700 | $156,500 |
| 2019 | $3,745 | $219,900 | $63,600 | $156,300 |
| 2018 | $3,487 | $201,900 | $63,600 | $138,300 |
| 2017 | $3,491 | $207,200 | $63,600 | $143,600 |
| 2016 | $3,508 | $207,200 | $63,600 | $143,600 |
| 2015 | $3,272 | $207,200 | $63,600 | $143,600 |
| 2014 | $3,216 | $214,400 | $63,600 | $150,800 |
Source: Public Records
Map
Nearby Homes