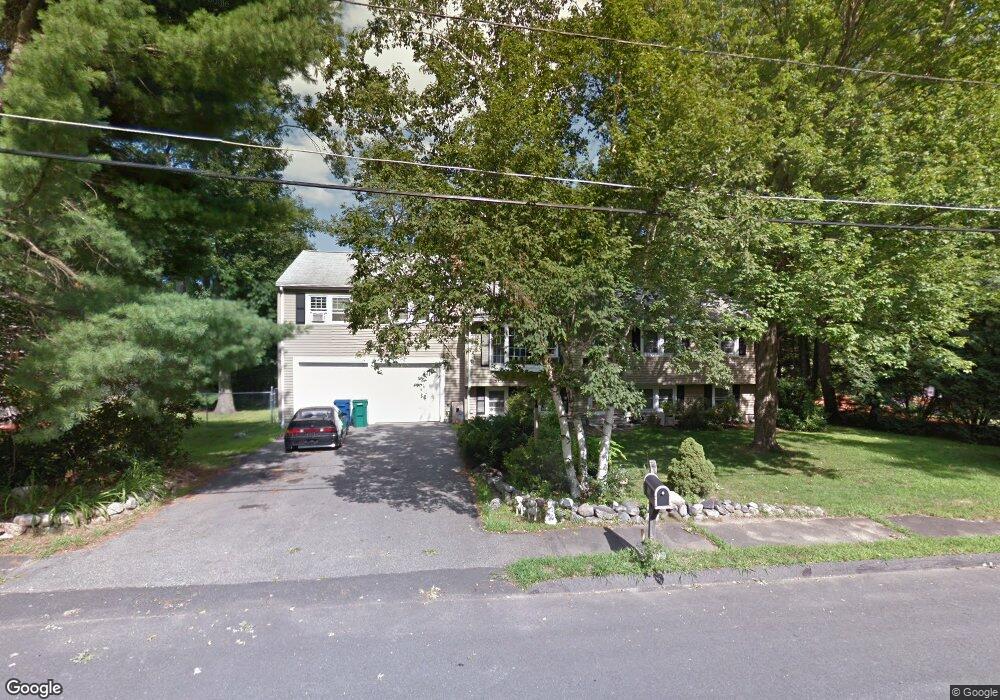
60 Dyer St North Billerica, MA 01862
Estimated Value: $808,000 - $877,000
4
Beds
3
Baths
2,842
Sq Ft
$300/Sq Ft
Est. Value
About This Home
This home is located at 60 Dyer St, North Billerica, MA 01862 and is currently estimated at $851,358, approximately $299 per square foot. 60 Dyer St is a home located in Middlesex County with nearby schools including Billerica Memorial High School and Knowledge Beginnings South.
Ownership History
Date
Name
Owned For
Owner Type
Purchase Details
Closed on
Nov 26, 2008
Sold by
Chau Bup T
Bought by
Fitzgerald Darlene J and Fitzgerald Paul J
Current Estimated Value
Purchase Details
Closed on
Jun 19, 2007
Sold by
Albano Janet J and Dionne Janet
Bought by
Chau Bup T
Home Financials for this Owner
Home Financials are based on the most recent Mortgage that was taken out on this home.
Original Mortgage
$314,000
Interest Rate
6.19%
Mortgage Type
Purchase Money Mortgage
Purchase Details
Closed on
Sep 7, 2004
Sold by
Albano Janet J and Albano John V
Bought by
Albano Janet J
Create a Home Valuation Report for This Property
The Home Valuation Report is an in-depth analysis detailing your home's value as well as a comparison with similar homes in the area
Home Values in the Area
Average Home Value in this Area
Purchase History
| Date | Buyer | Sale Price | Title Company |
|---|---|---|---|
| Fitzgerald Darlene J | -- | -- | |
| Chau Bup T | $392,500 | -- | |
| Albano Janet J | -- | -- |
Source: Public Records
Mortgage History
| Date | Status | Borrower | Loan Amount |
|---|---|---|---|
| Previous Owner | Chau Bup T | $314,000 |
Source: Public Records
Tax History Compared to Growth
Tax History
| Year | Tax Paid | Tax Assessment Tax Assessment Total Assessment is a certain percentage of the fair market value that is determined by local assessors to be the total taxable value of land and additions on the property. | Land | Improvement |
|---|---|---|---|---|
| 2025 | $7,820 | $687,800 | $282,900 | $404,900 |
| 2024 | $7,189 | $636,800 | $277,300 | $359,500 |
| 2023 | $6,971 | $587,300 | $242,000 | $345,300 |
| 2022 | $6,470 | $511,900 | $210,400 | $301,500 |
| 2021 | $6,214 | $478,000 | $185,700 | $292,300 |
| 2020 | $5,977 | $460,100 | $178,100 | $282,000 |
| 2019 | $5,798 | $430,100 | $178,100 | $252,000 |
| 2018 | $5,612 | $395,500 | $158,100 | $237,400 |
| 2017 | $5,187 | $368,100 | $153,100 | $215,000 |
| 2016 | $5,158 | $364,800 | $149,800 | $215,000 |
| 2015 | $5,122 | $364,800 | $149,800 | $215,000 |
| 2014 | $5,169 | $361,700 | $143,500 | $218,200 |
Source: Public Records
Map
Nearby Homes