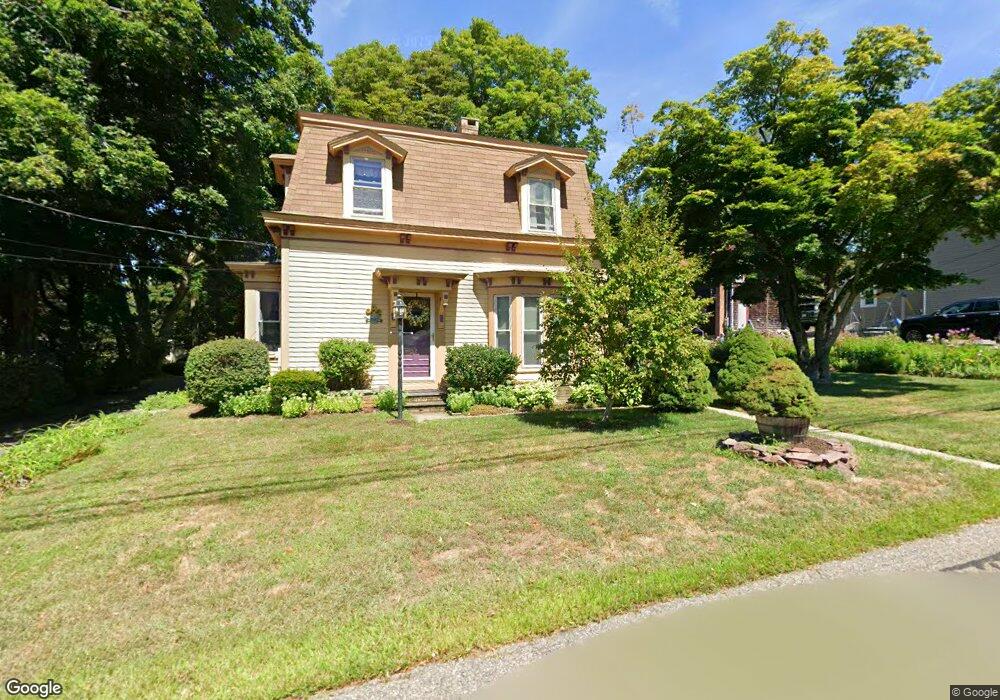
60 E Bacon St Plainville, MA 02762
Estimated Value: $509,000 - $676,000
4
Beds
1
Bath
1,949
Sq Ft
$291/Sq Ft
Est. Value
About This Home
This home is located at 60 E Bacon St, Plainville, MA 02762 and is currently estimated at $566,795, approximately $290 per square foot. 60 E Bacon St is a home located in Norfolk County with nearby schools including Anna Ware Jackson School, Beatrice H. Wood Elementary School, and Discovery Daycare Center.
Ownership History
Date
Name
Owned For
Owner Type
Purchase Details
Closed on
Jul 13, 2015
Sold by
Romsey Ret and Romsey
Bought by
Romsey Ft and Romsey
Current Estimated Value
Purchase Details
Closed on
May 5, 2011
Sold by
Romsey Harry D and Romsey Carolyn J
Bought by
Romsey Ret and Romsey
Purchase Details
Closed on
Apr 13, 1973
Bought by
Romsey Harry D and Romsey Carolyn J
Create a Home Valuation Report for This Property
The Home Valuation Report is an in-depth analysis detailing your home's value as well as a comparison with similar homes in the area
Home Values in the Area
Average Home Value in this Area
Purchase History
| Date | Buyer | Sale Price | Title Company |
|---|---|---|---|
| Romsey Ft | -- | -- | |
| Romsey Ret | -- | -- | |
| Romsey Harry D | -- | -- |
Source: Public Records
Mortgage History
| Date | Status | Borrower | Loan Amount |
|---|---|---|---|
| Previous Owner | Romsey Harry D | $120,000 | |
| Previous Owner | Romsey Harry D | $81,000 | |
| Previous Owner | Romsey Harry D | $15,000 |
Source: Public Records
Tax History
| Year | Tax Paid | Tax Assessment Tax Assessment Total Assessment is a certain percentage of the fair market value that is determined by local assessors to be the total taxable value of land and additions on the property. | Land | Improvement |
|---|---|---|---|---|
| 2025 | $49 | $423,700 | $211,200 | $212,500 |
| 2024 | $4,756 | $396,300 | $191,700 | $204,600 |
| 2023 | $4,697 | $376,400 | $191,700 | $184,700 |
| 2022 | $4,593 | $327,400 | $183,800 | $143,600 |
| 2021 | $4,560 | $310,200 | $183,800 | $126,400 |
| 2020 | $4,476 | $304,500 | $183,800 | $120,700 |
| 2019 | $4,662 | $311,400 | $183,800 | $127,600 |
Source: Public Records
Map
Nearby Homes
- 20 South St
- 20 Woodridge St
- 28 Sunset Ln
- 56 Parmenter Ln
- 31 Whiting St
- 35-R Whiting St
- 9 Fletcher St
- 19 Valerie Dr
- 271 N Washington St
- 5 Farm Hill Ln
- 28 Messenger St
- 6 Al Pace Dr Unit B
- 3 Riley Ct
- 212 Fisher St Unit A13
- 200 Smith St
- 157 Fisher St
- 12 Houde St
- 0 Berry St
- Lot 5 Jeffrey Dr
- 158 Washington St
Your Personal Tour Guide
Ask me questions while you tour the home.